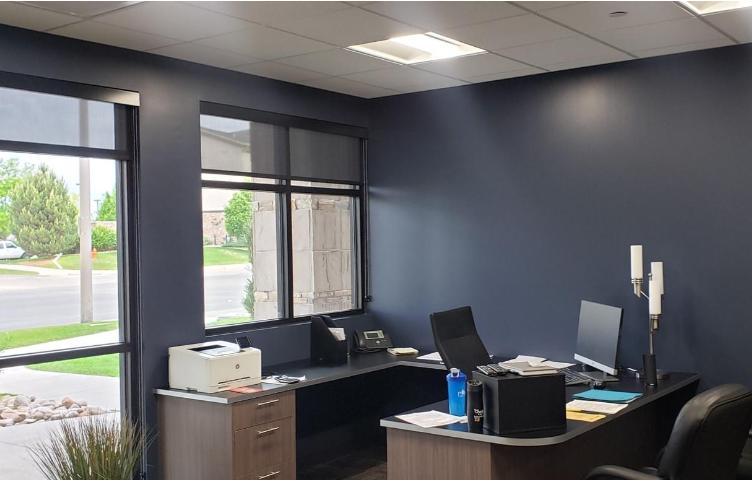
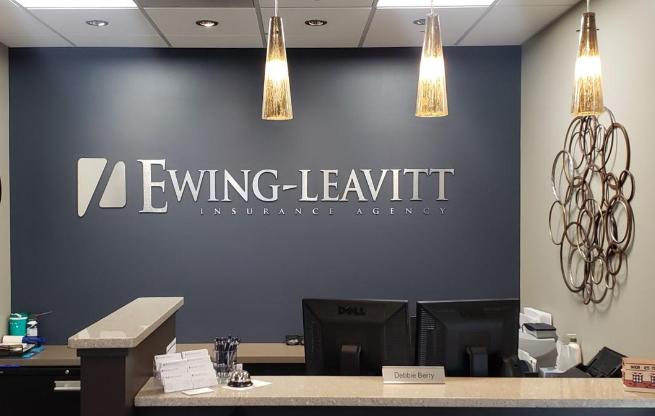
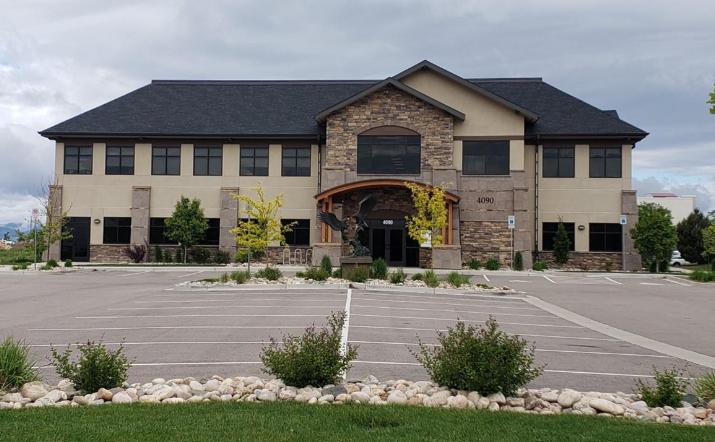
1-Mile | 3-Miles | 5-Miles | ||
---|---|---|---|---|
Total Population | 1,633 | 14,385 | 64,126 | |
Population Median Age | 39 | 39 | 38 | |
Population by Age | 0-9 Yrs | 184 (11%) | 1598 (11%) | 7634 (11%) |
10-19 Yrs | 247 (15%) | 2214 (15%) | 9504 (14%) | |
20-29 Yrs | 196 (12%) | 1646 (11%) | 7788 (12%) | |
30-39 Yrs | 171 (10%) | 1584 (11%) | 8554 (13%) | |
40-49 Yrs | 299 (18%) | 2481 (17%) | 9076 (14%) | |
50-59 Yrs | 186 (11%) | 1764 (12%) | 8068 (12%) | |
60-69 Yrs | 224 (13%) | 1809 (12%) | 7522 (11%) | |
70+ Yrs | 127 (7%) | 1289 (8%) | 5981 (9%) | |
Median HH Income | $97,639 | $97,256 | $83,421 | |
Total Household Income | < 24K | 130 (19%) | 947 (16%) | 3125 (12%) |
25-49K | 62 (9%) | 633 (11%) | 4095 (16%) | |
50-74K | 46 (7%) | 537 (9%) | 3717 (15%) | |
75-99K | 100 (15%) | 818 (14%) | 3761 (15%) | |
100-199K | 217 (33%) | 1890 (33%) | 7252 (29%) | |
200K+ | 102 (15%) | 866 (15%) | 2458 (10%) | |
Highest Education Level | No Diploma | 23 | 315 | 2045 |
Diploma or GED | 163 | 1560 | 8912 | |
Some College | 235 | 1935 | 9411 | |
Assoc. Degree | 71 | 658 | 4291 | |
Bachelors Degree | 346 | 3059 | 11294 | |
Higher Degree | 226 | 1984 | 7122 | |
Total Housing Units | 697 | 5,995 | 25,333 | |
--Owner-Occupied | 398 | 3,796 | 17,366 | |
--Renter-Occupied | 259 | 1,894 | 7,043 | |
Owner-Occupied Values | < 100K | 0 | 172 | 1165 |
100-199K | 6 | 93 | 1015 | |
200-299K | 45 | 415 | 3600 | |
300-399K | 46 | 534 | 4351 | |
400-499K | 86 | 761 | 2730 | |
500K+ | 213 | 1822 | 4504 | |
Total Working Age Population | 1,219 | 10,874 | 49,556 | |
In Work Force | 810 | 7,177 | 33,555 | |
Not In Work Force | 410 | 3,697 | 16,001 | |
Workforce Employed | 768 | 6,865 | 32,276 | |
Workforce Unemployed | 42 | 310 | 1,265 | |
Civlian Workforce | 810 | 7,174 | 33,541 | |
Military Workforce | 0 | 2 | 14 | |
Total Households | 657 | 5,690 | 24,409 | |
Family Households | 393 | 3,593 | 16,824 | |
Non-Family Households | 264 | 2,097 | 7,585 | |
Married Couple | 366 | 3,303 | 14,025 | |
Other Family | 27 | 290 | 2,800 | |
Married w/Child | 172 | 1,527 | 6,033 | |
Single Male w/Child | 0 | 9 | 488 | |
Single Female w/Child | 12 | 101 | 736 |
Population Change Last Two Decades - Plus Projection
2000 | % | 2010 | % | 2020 | % | 2030 | |
---|---|---|---|---|---|---|---|
Colorado | 4,301,261 | +17 | 5,029,196 | +16 | 5,838,181 | +15 | 6,733,658 |
Larimer County | 251,494 | +19 | 299,630 | +20 | 359,181 | +18 | 424,052 |
Weld County | 180,936 | +40 | 252,825 | +32 | 333,149 | +36 | 453,421 |
Total Working Age Population:
Total Households:
Total Working Age Population:
Total Households:
Total Working Age Population:
Total Households: