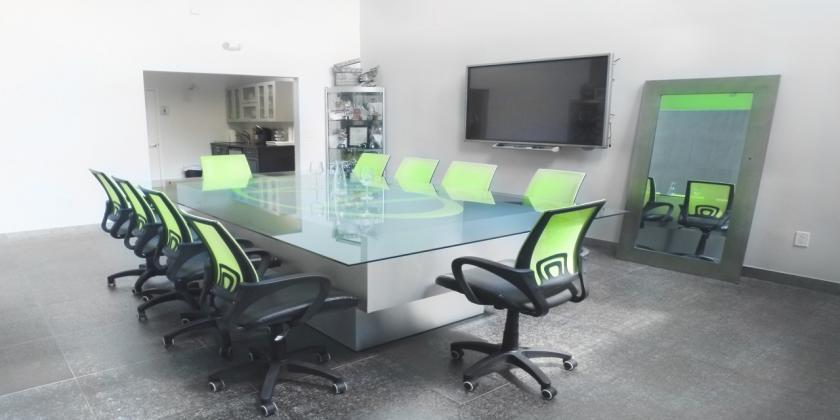
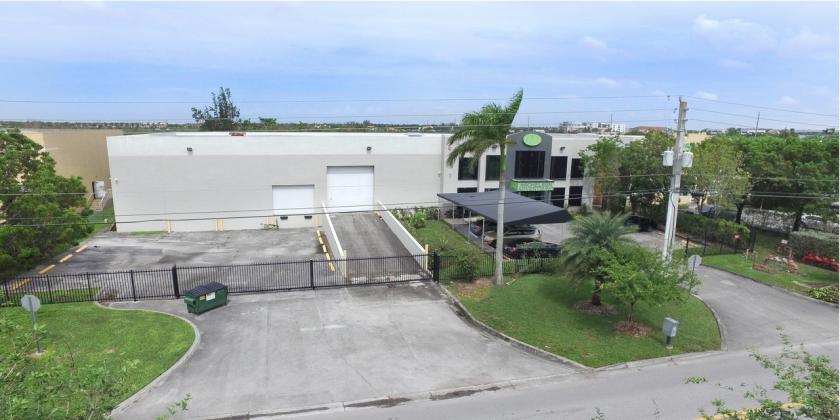
1-Mile | 3-Miles | 5-Miles | ||
---|---|---|---|---|
Total Population | 8,304 | 121,796 | 300,435 | |
Population Median Age | 37 | 39 | 41 | |
Population by Age | 0-9 Yrs | 1080 (13%) | 13580 (11%) | 30098 (10%) |
10-19 Yrs | 1275 (15%) | 14663 (12%) | 33477 (11%) | |
20-29 Yrs | 723 (8%) | 16356 (13%) | 39691 (13%) | |
30-39 Yrs | 1257 (15%) | 16886 (13%) | 39829 (13%) | |
40-49 Yrs | 1570 (18%) | 19082 (15%) | 44971 (14%) | |
50-59 Yrs | 1228 (14%) | 17623 (14%) | 44297 (14%) | |
60-69 Yrs | 668 (8%) | 12408 (10%) | 31513 (10%) | |
70+ Yrs | 502 (6%) | 11199 (9%) | 36559 (12%) | |
Median HH Income | $85,232 | $59,404 | $55,643 | |
Total Household Income | < 24K | 248 (9%) | 6940 (18%) | 19025 (21%) |
25-49K | 354 (14%) | 8963 (24%) | 21959 (24%) | |
50-74K | 486 (19%) | 6629 (17%) | 16533 (18%) | |
75-99K | 379 (15%) | 5310 (14%) | 12023 (13%) | |
100-199K | 824 (33%) | 7843 (21%) | 16877 (18%) | |
200K+ | 195 (7%) | 1565 (4%) | 3543 (3%) | |
Highest Education Level | No Diploma | 552 | 15114 | 42564 |
Diploma or GED | 854 | 18691 | 55413 | |
Some College | 400 | 9667 | 27306 | |
Assoc. Degree | 770 | 10094 | 22286 | |
Bachelors Degree | 1719 | 20367 | 46653 | |
Higher Degree | 1324 | 12562 | 23848 | |
Total Housing Units | 3,345 | 43,636 | 100,194 | |
--Owner-Occupied | 1,515 | 18,102 | 49,856 | |
--Renter-Occupied | 970 | 19,148 | 40,105 | |
Owner-Occupied Values | < 100K | 9 | 1323 | 4071 |
100-199K | 80 | 4536 | 10831 | |
200-299K | 341 | 4019 | 12092 | |
300-399K | 562 | 3509 | 11502 | |
400-499K | 214 | 2202 | 6488 | |
500K+ | 310 | 2514 | 4871 | |
Total Working Age Population | 6,536 | 99,145 | 251,889 | |
In Work Force | 4,328 | 64,287 | 155,193 | |
Not In Work Force | 2,208 | 34,857 | 96,696 | |
Workforce Employed | 4,143 | 61,948 | 149,129 | |
Workforce Unemployed | 175 | 2,270 | 5,968 | |
Civlian Workforce | 4,318 | 64,218 | 155,097 | |
Military Workforce | 10 | 69 | 96 | |
Total Households | 2,485 | 37,249 | 89,960 | |
Family Households | 2,065 | 29,195 | 70,072 | |
Non-Family Households | 420 | 8,055 | 19,888 | |
Married Couple | 1,619 | 19,171 | 45,827 | |
Other Family | 446 | 10,024 | 24,246 | |
Married w/Child | 799 | 8,842 | 18,723 | |
Single Male w/Child | 50 | 893 | 2,255 | |
Single Female w/Child | 144 | 2,792 | 6,316 |
Population Change Last Two Decades - Plus Projection
2000 | % | 2010 | % | 2020 | % | 2030 | |
---|---|---|---|---|---|---|---|
Florida | 15,982,378 | +18 | 18,801,310 | +14 | 21,517,610 | +13 | 24,340,457 |
Miami-Dade County | 2,253,362 | +11 | 2,496,435 | +15 | 2,861,579 | +11 | 3,190,242 |
Monroe County | 79,589 | -8 | 73,090 | +1 | 74,004 | 0 | 74,301 |
Total Working Age Population:
Total Households:
Total Working Age Population:
Total Households:
Total Working Age Population:
Total Households: