Industrial Properties
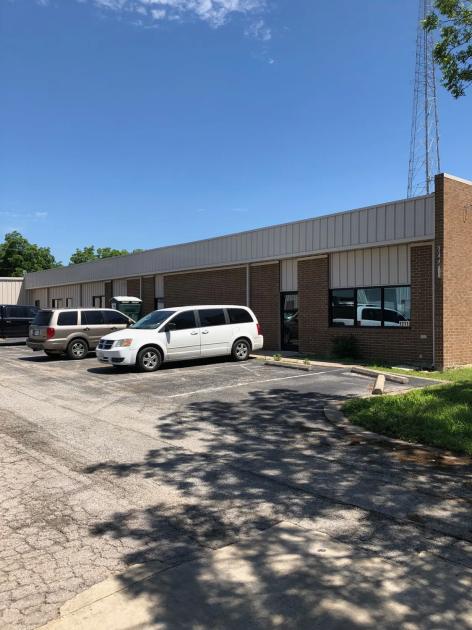
12112 Roxie Drive Austin, TX 78729
12112 Roxie Drive Austin, TX 78729

Details & Description
Property Highlights
- • ADA Rest Rooms
- • Break Room / Coffee Bars
- • Modern Tile Floors in HVAC area
- • 16 Ft. roll up doors in the rear of all Suites
- • Drop down LED lighting in all warehouse areas
Additional Photos


Listing Agents

Andrew Creixell
O: 512-447-2222
andrew@csarealtygroup.com
O: 512-447-2222
andrew@csarealtygroup.com
While we strive to provide the most accurate information, all listing information, and demographic data, is provided by third-parties. As such, MyEListing will not be responsible for the accuracy of the information. It is strongly recommended that you verify all information with the listing agent, and any relevant agencies, prior to making any decisions.


