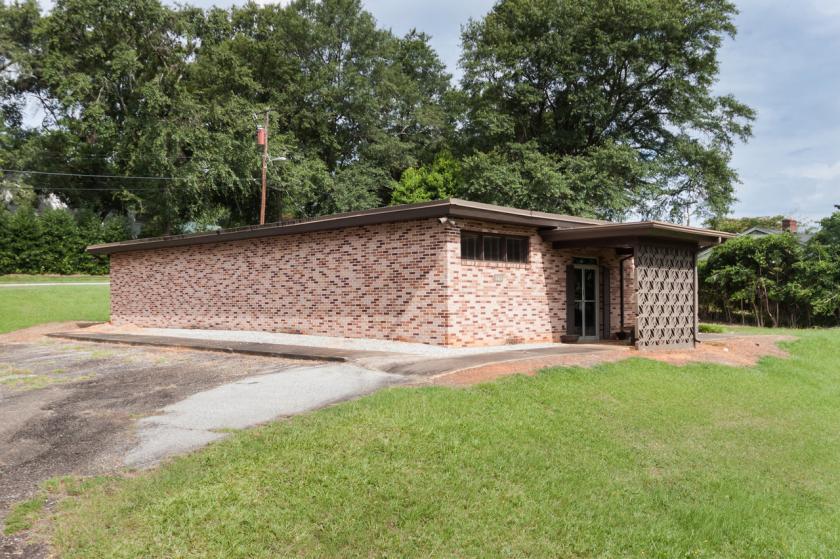
Office Space
101 Pickens Drive Liberty, SC 29657
101 Pickens Drive Liberty, SC 29657
Details & Description
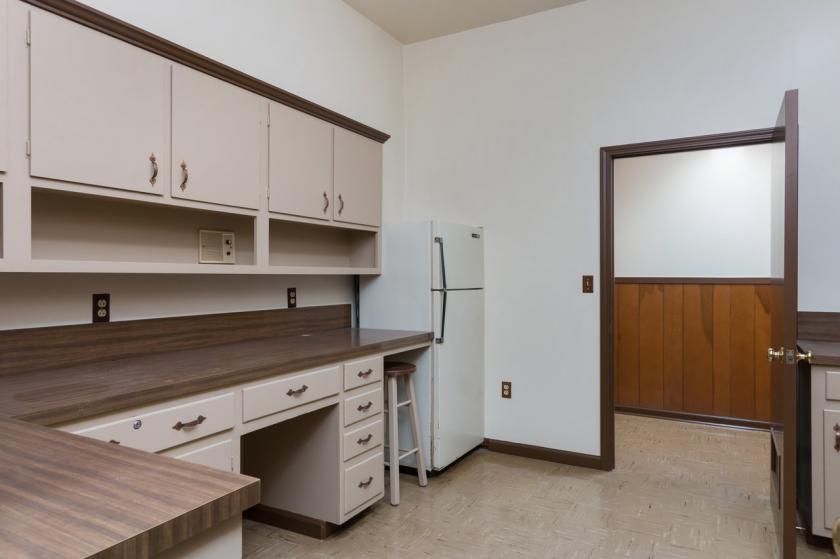
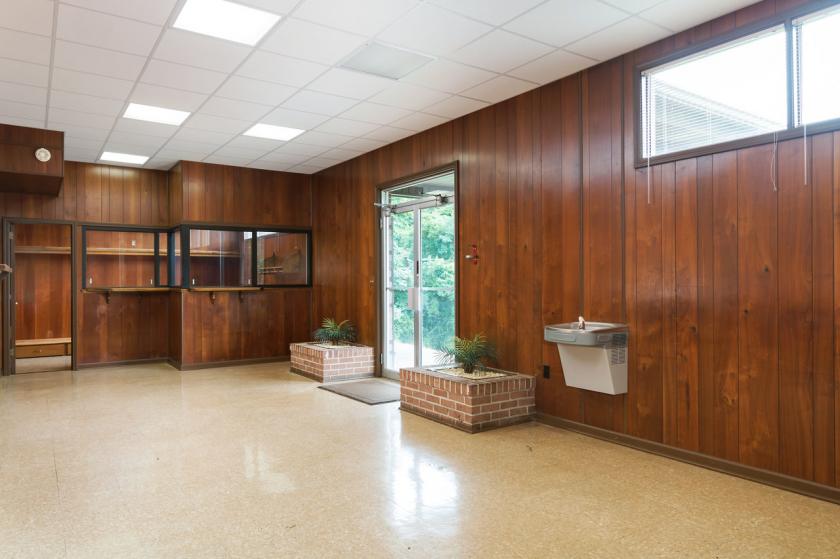
Additional Photos

Listing Agents

Hope Tz Schmalzl
O: 864-630-0352
M: 864-630-0352
Hopetz@joynercommercial.com
O: 864-630-0352
M: 864-630-0352
Hopetz@joynercommercial.com
While we strive to provide the most accurate information, all listing information, and demographic data, is provided by third-parties. As such, MyEListing will not be responsible for the accuracy of the information. It is strongly recommended that you verify all information with the listing agent, and any relevant agencies, prior to making any decisions.


