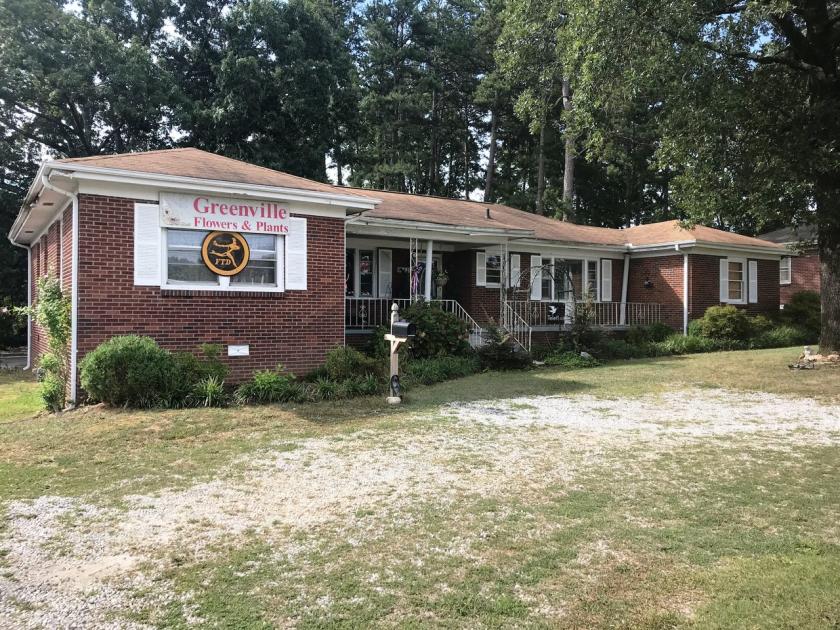
1-Mile | 3-Miles | 5-Miles | ||
---|---|---|---|---|
Total Population | 6,764 | 63,275 | 142,620 | |
Population Median Age | 40 | 39 | 39 | |
Population by Age | 0-9 Yrs | 783 (11%) | 6771 (10%) | 16608 (11%) |
10-19 Yrs | 884 (13%) | 7806 (12%) | 16667 (11%) | |
20-29 Yrs | 767 (11%) | 10128 (16%) | 22022 (15%) | |
30-39 Yrs | 926 (13%) | 8760 (13%) | 19899 (13%) | |
40-49 Yrs | 892 (13%) | 7649 (12%) | 17676 (12%) | |
50-59 Yrs | 861 (12%) | 7942 (12%) | 18244 (12%) | |
60-69 Yrs | 813 (12%) | 7074 (11%) | 16401 (11%) | |
70+ Yrs | 838 (12%) | 7145 (11%) | 15105 (10%) | |
Median HH Income | $53,998 | $57,362 | $59,120 | |
Total Household Income | < 24K | 498 (18%) | 4223 (16%) | 10957 (18%) |
25-49K | 717 (26%) | 6678 (26%) | 13990 (23%) | |
50-74K | 647 (23%) | 5121 (20%) | 10489 (17%) | |
75-99K | 344 (12%) | 3637 (14%) | 8118 (13%) | |
100-199K | 439 (16%) | 4791 (18%) | 11324 (19%) | |
200K+ | 95 (3%) | 1031 (4%) | 3715 (6%) | |
Highest Education Level | No Diploma | 728 | 3474 | 9091 |
Diploma or GED | 1251 | 9075 | 19751 | |
Some College | 875 | 8787 | 19079 | |
Assoc. Degree | 453 | 4783 | 10153 | |
Bachelors Degree | 933 | 10923 | 26062 | |
Higher Degree | 444 | 6236 | 15203 | |
Total Housing Units | 2,941 | 27,498 | 64,598 | |
--Owner-Occupied | 1,735 | 15,798 | 34,556 | |
--Renter-Occupied | 1,004 | 9,683 | 24,037 | |
Owner-Occupied Values | < 100K | 300 | 1881 | 4455 |
100-199K | 861 | 7280 | 13291 | |
200-299K | 254 | 3677 | 7925 | |
300-399K | 178 | 1785 | 4456 | |
400-499K | 81 | 623 | 1749 | |
500K+ | 62 | 551 | 2682 | |
Total Working Age Population | 5,539 | 52,213 | 116,016 | |
In Work Force | 3,598 | 34,927 | 76,909 | |
Not In Work Force | 1,941 | 17,285 | 39,107 | |
Workforce Employed | 3,386 | 33,496 | 73,765 | |
Workforce Unemployed | 212 | 1,384 | 3,053 | |
Civlian Workforce | 3,598 | 34,879 | 76,818 | |
Military Workforce | 0 | 48 | 90 | |
Total Households | 2,739 | 25,480 | 58,594 | |
Family Households | 1,692 | 15,566 | 35,048 | |
Non-Family Households | 1,046 | 9,915 | 23,546 | |
Married Couple | 1,174 | 11,842 | 26,367 | |
Other Family | 518 | 3,724 | 8,680 | |
Married w/Child | 447 | 4,395 | 10,333 | |
Single Male w/Child | 125 | 556 | 1,371 | |
Single Female w/Child | 163 | 1,431 | 3,172 |
Population Change Last Two Decades - Plus Projection
2000 | % | 2010 | % | 2020 | % | 2030 | |
---|---|---|---|---|---|---|---|
South Carolina | 4,012,012 | +15 | 4,625,364 | +9 | 5,020,400 | +9 | 5,488,460 |
Greenville County | 379,616 | +19 | 451,225 | +9 | 492,890 | +10 | 542,290 |
Total Working Age Population:
Total Households:
Total Working Age Population:
Total Households:
Total Working Age Population:
Total Households: