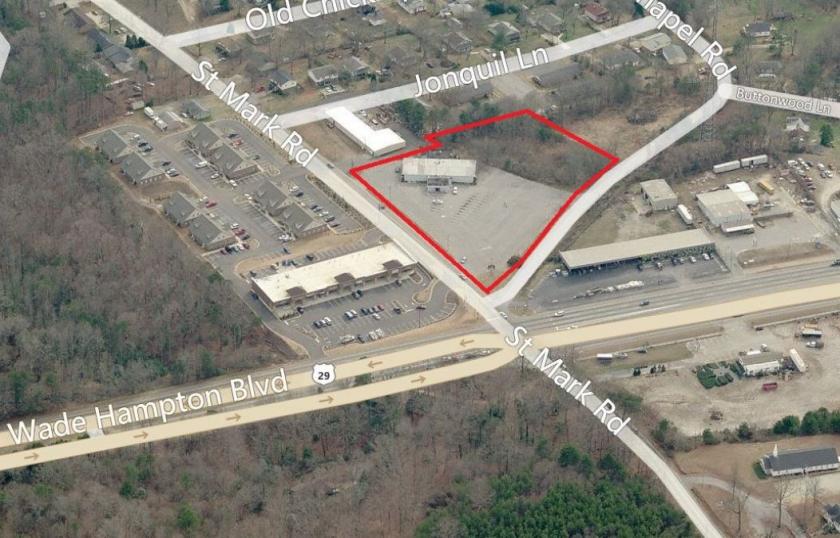
This property is located on St. Mark Rd and Wade Hampton Blvd. just 7± miles from downtown Greenville and Interstate 85. Excellent redevelopment opportunity with great visibility on a highly traveled road.
• 3± Acres
• Lighted intersection
• Additional contiguous land available
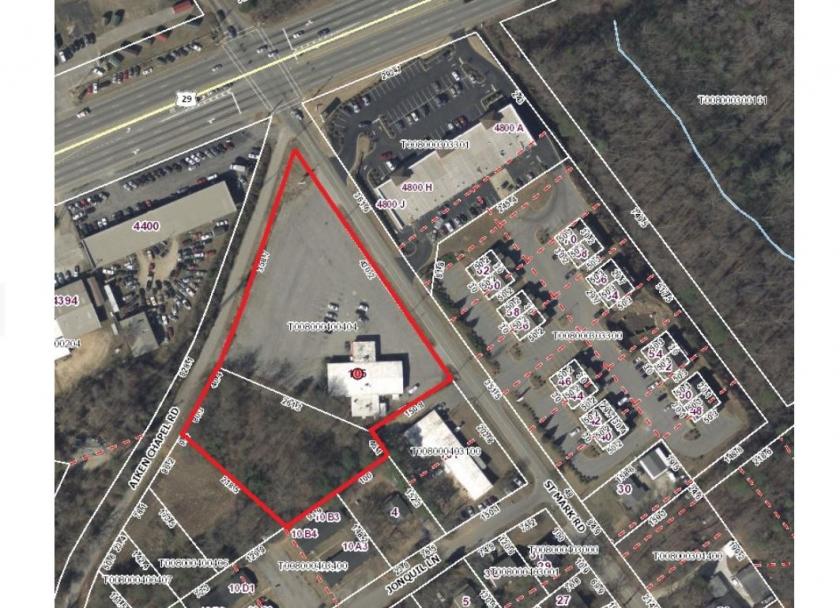
• 430± ft of frontage on St Mark Rd.
• 480± ft of frontage on Aiken Chapel Rd
• Wade Hampton Blvd Traffic Count: 31,900 (2012 gcgis)
• St Mark Rd Traffic Count: 4,600 cpd (2010 esri)
• Excellent Retail Corridor
• Tax Map#: T008000400404 & T008000400405
No part of this information may be copied, reproduced, repurposed, or screen-captured for any commercial purpose without prior written authorization from MyEListing.
While we strive to provide the most accurate information, all listing information, and demographic data, is provided by third-parties. As such, MyEListing will not be responsible for the accuracy of the information. It is strongly recommended that you verify all information with the listing agent, and any relevant agencies, prior to making any decisions.
What is the asking price for 105 Saint Mark Road in Taylors?
The asking price for 105 Saint Mark Road is $1,600,000
How much land does the Taylors, SC property at 105 Saint Mark Road include?
105 Saint Mark Road in Taylors includes 3.000 acres of land
What kind of Land is the propery at 105 Saint Mark Road?
The property at 105 Saint Mark Road Taylors, SC 29687 is listed as a Mixed Use Land Land property
What is the population within 1 mile of 105 Saint Mark Road in Taylors?
The population within 1 mile of 105 Saint Mark Road Taylors, SC 29687 is 3,445 people.
Who do I contact for questions about 105 Saint Mark Road?
You should contact the listing agent,
Matt Carter, for any details regarding this commercial listing.