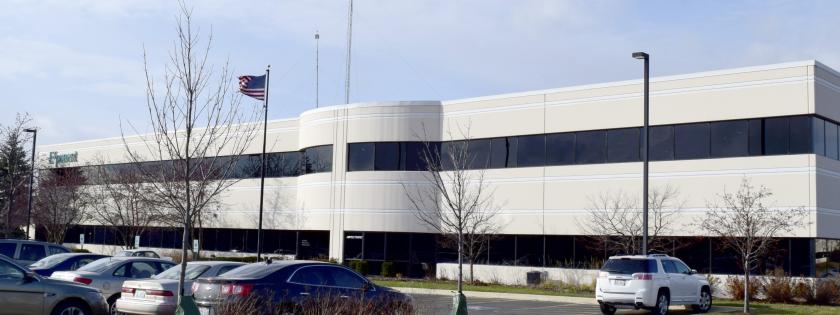
Conveniently located less than a minute from the four-way interchange of I-88 Winfield Road, your gateway to the greater Chicagoland area.
Beautifully finished granite through all common areas and washrooms. Washrooms also include showers.
Smart building with state of the art facilities such as: Fiber Optics, Security Cameras, Keyless entry, Web-based HVAC software and Closed Circuit Distribution System
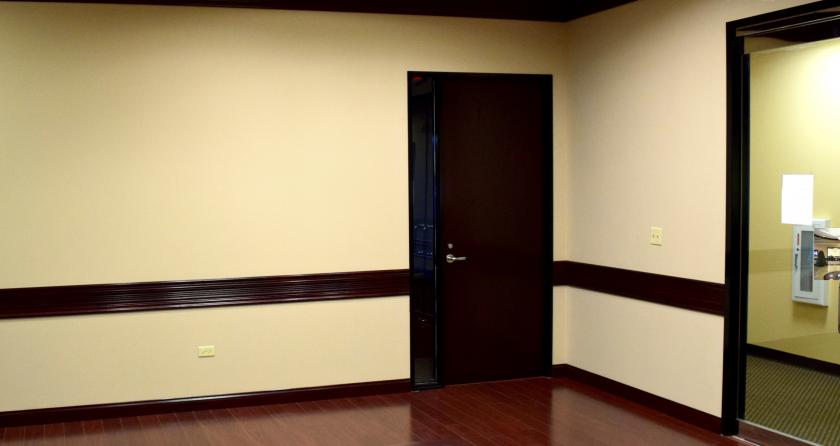
Spaciously designed smart conference room with a built-in computer, fiber optics, speakers and projector creates a fully connected collaborative workspace for your employees, maximizing your team’s efficiency.
24-hour access to the building allows for flexibility for all tenants.
Nearby Hotels, Food, Fitness Centers and Day Care centers help maintain easier work-life balance for all tenants.
No part of this information may be copied, reproduced, repurposed, or screen-captured for any commercial purpose without prior written authorization from MyEListing.
While we strive to provide the most accurate information, all listing information, and demographic data, is provided by third-parties. As such, MyEListing will not be responsible for the accuracy of the information. It is strongly recommended that you verify all information with the listing agent, and any relevant agencies, prior to making any decisions.
What is the building size of this commercial Office property?
The size of this multi-unit property varies between 2170 - 12855 square feet
What kind of Office is the propery at 4580 Weaver Parkway?
The property at 4580 Weaver Parkway Warrenville, IL 60555 is listed as a Professional Office property
What is the population within 1 mile of 4580 Weaver Parkway in Warrenville?
The population within 1 mile of 4580 Weaver Parkway Warrenville, IL 60555 is 5,788 people.
Who do I contact for questions about 4580 Weaver Parkway?
You should contact the listing agent,
Dynacom Center, for any details regarding this commercial listing.