Property Highlights
±1,170 SF and ±2,690 SF Retail Spaces
Ideal for a Convenience Store, Cellphone Store, Deli, Coffee Shop
New Constructed Residential Apartments on Upper Floors
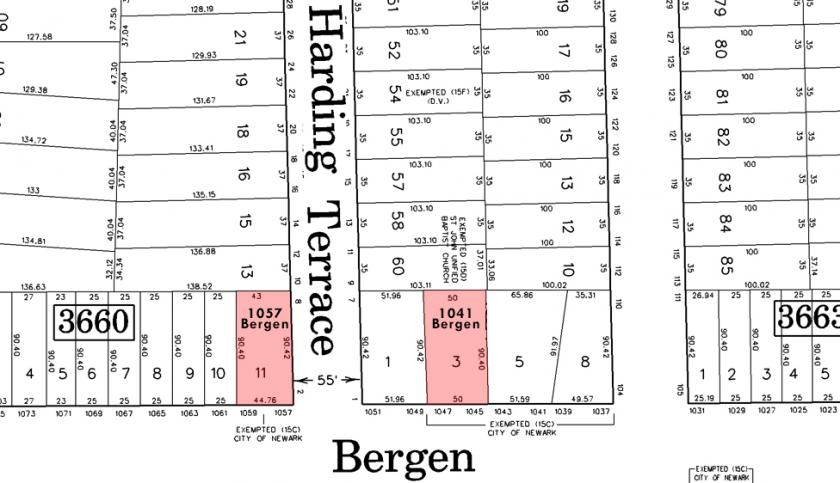
Situated at Traffic Light Corner Lot Intersection of Bergen Street and Harding Terrace
In Front of Bus Stop (NJ Transit Buses 39 and 99 Servicing Irvington and Hillside Lines)
Located One Block from Weequahic Park and Newark Beth Israel Medical Center
8,976 AADT at Bergen Street & Scheerer Avenue (2018)
Street Retail A
1,170 SF$22 PSF Gross Lease
Street Retail B
2,690 SF$22 PSF Gross Lease
Location
Approx. 1 Miles to I-78
Approx. 1.3 Miles to US Highway 1 & 9
Approx. 3.2 Miles to Newark Liberty International Airport
Approx. 11.3 Miles to Holland Tunnel
Approx. 14.2 Miles to Lincoln Tunnel
No part of this information may be copied, reproduced, repurposed, or screen-captured for any commercial purpose without prior written authorization from MyEListing.
While we strive to provide the most accurate information, all listing information, and demographic data, is provided by third-parties. As such, MyEListing will not be responsible for the accuracy of the information. It is strongly recommended that you verify all information with the listing agent, and any relevant agencies, prior to making any decisions.
What is the asking price for 1041 Bergen Street in Newark?
The asking price for 1041 Bergen Street is $22.00 a SF per Year
What is the building size of this commercial Retail property?
The size of this lease property at '.1041 Bergen Street.' is 3860 square feet
What kind of Retail is the propery at 1041 Bergen Street?
The property at 1041 Bergen Street Newark, NJ 07112 is listed as a Free Standing Building Retail property
What is the population within 1 mile of 1041 Bergen Street in Newark?
The population within 1 mile of 1041 Bergen Street Newark, NJ 07112 is 38,582 people.
Who do I contact for questions about 1041 Bergen Street?
You should contact the listing agent,
Karine Blanc, for any details regarding this commercial listing.