Specialty Real Estate
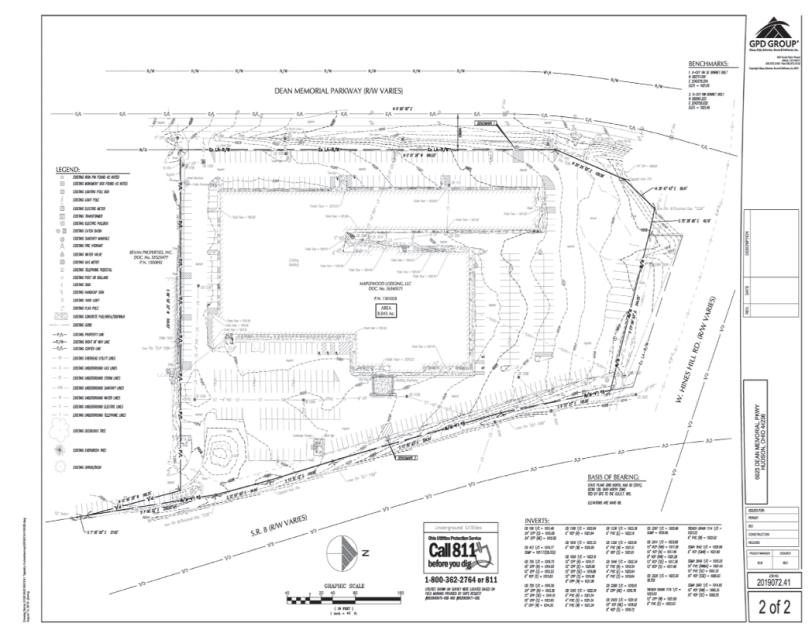
6625 Dean Memorial Parkway Hudson, OH 44236
6625 Dean Memorial Parkway Hudson, OH 44236
Details & Description
Property Highlights
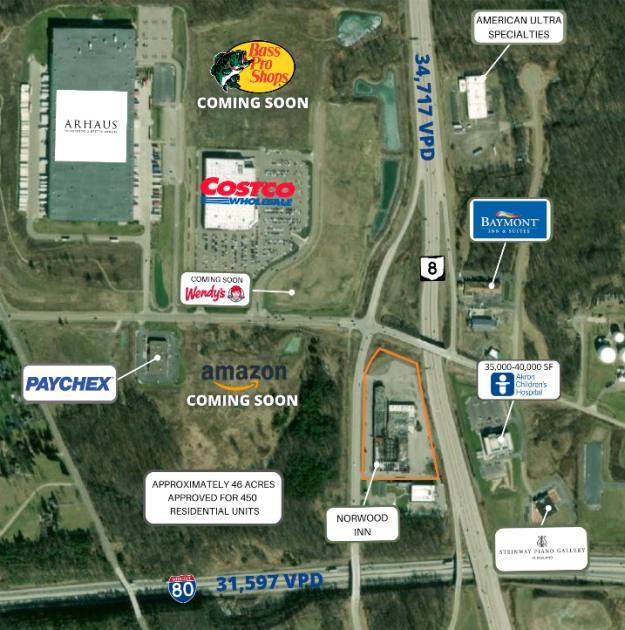
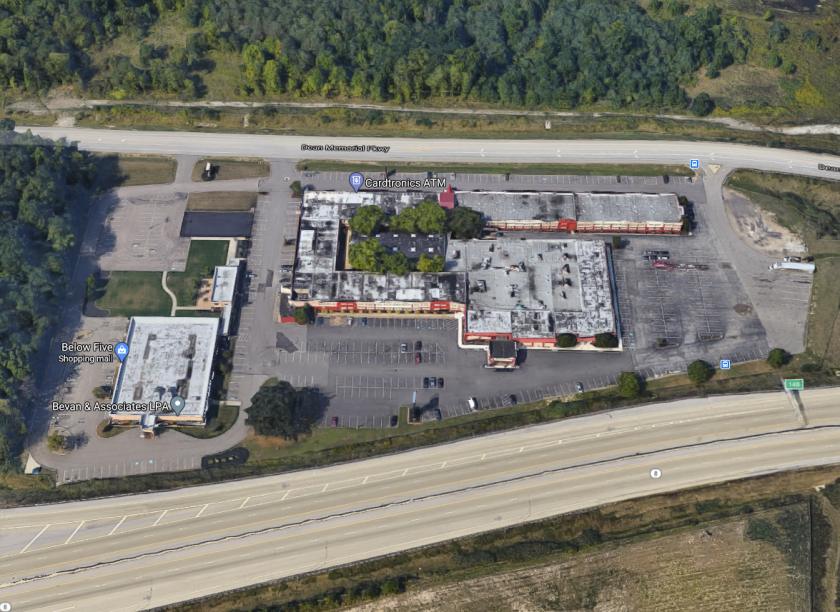
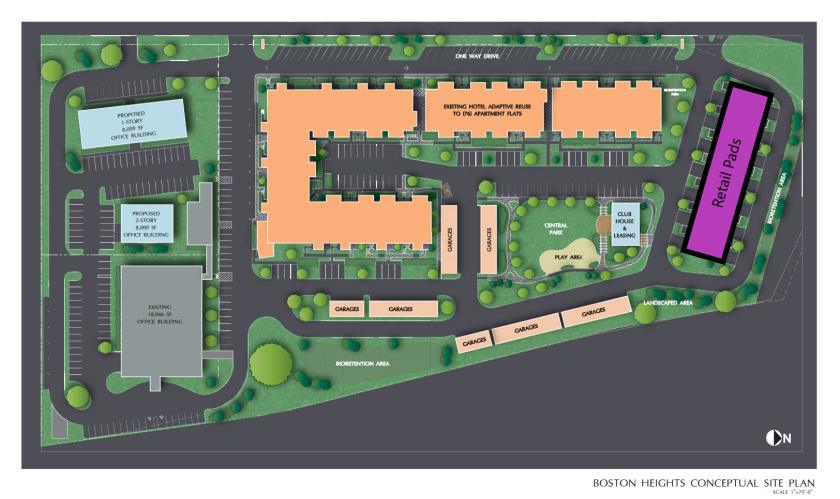
• There are 2 main structures on 8.24 acres, a 2 story hotel 106,000 SF, a 1 story restaurant 35,200 SF, and a pool house
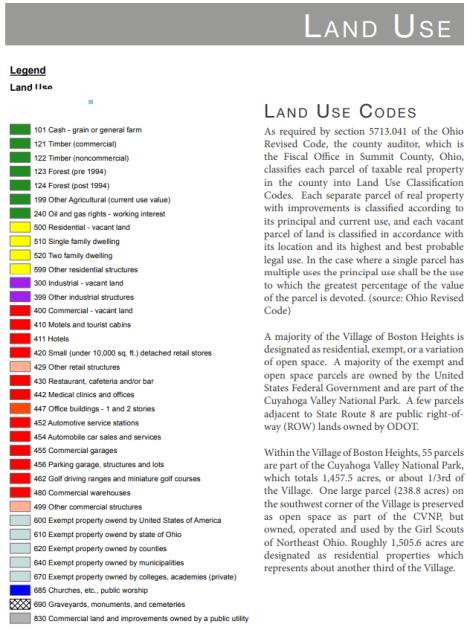
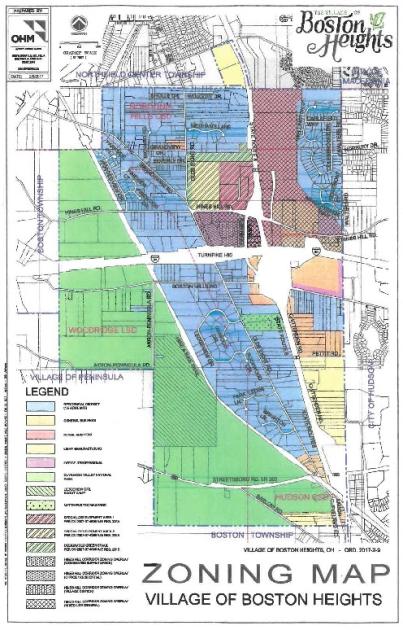
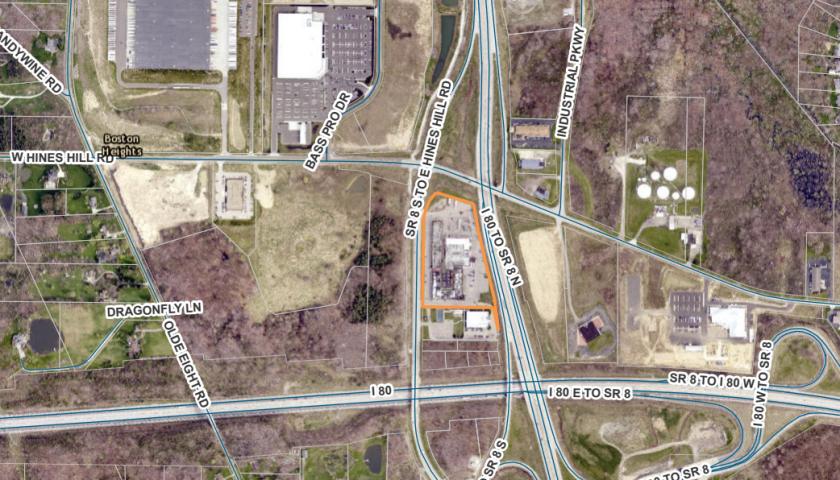
• This property is situated in the village of Boston Heights and was formerly a 239 room hotel called Norwood Inn.
Additional Photos

Listing Agents

Brad Weidman
O: 234-231-6251
M: 330-466-8550
brad.weidman@svn.com
O: 234-231-6251
M: 330-466-8550
brad.weidman@svn.com

Jerry Fiume
O: 234-231-0235
M: 330-416-0501
jerry.fiume@svn.com
O: 234-231-0235
M: 330-416-0501
jerry.fiume@svn.com
While we strive to provide the most accurate information, all listing information, and demographic data, is provided by third-parties. As such, MyEListing will not be responsible for the accuracy of the information. It is strongly recommended that you verify all information with the listing agent, and any relevant agencies, prior to making any decisions.