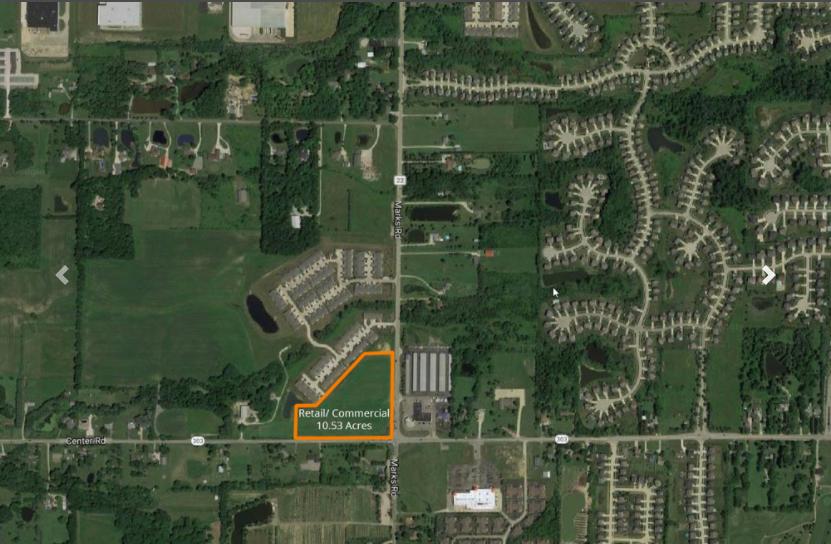
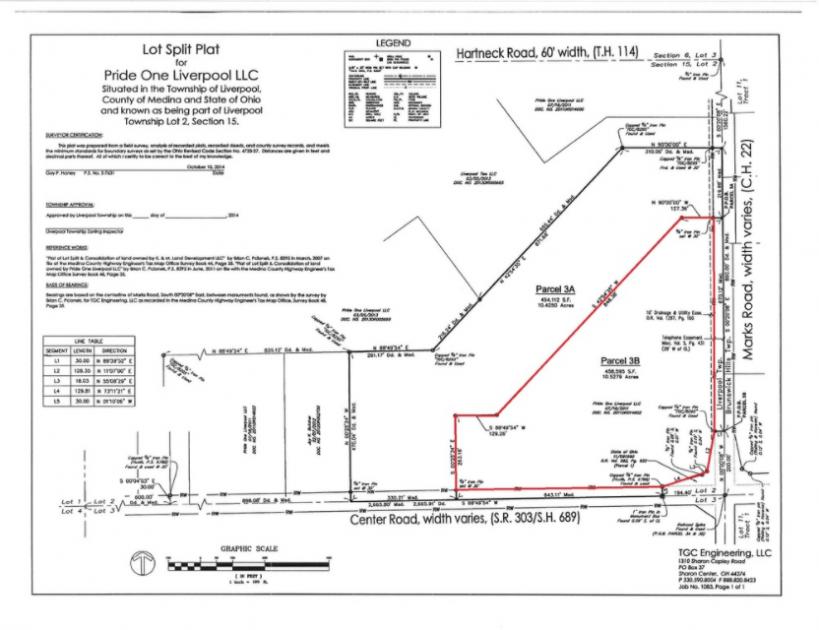
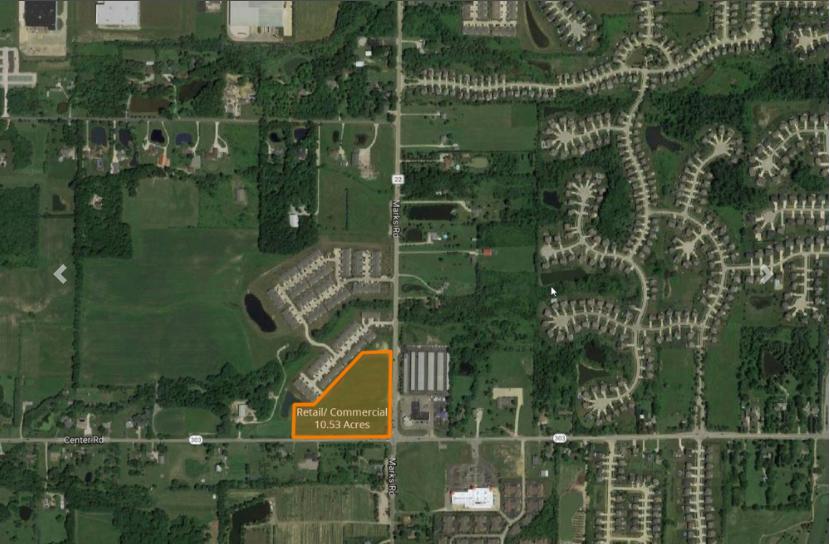
1-Mile | 3-Miles | 5-Miles | ||
---|---|---|---|---|
Total Population | 3,378 | 26,242 | 69,652 | |
Population Median Age | 36 | 40 | 41 | |
Population by Age | 0-9 Yrs | 532 (15%) | 3074 (11%) | 7713 (11%) |
10-19 Yrs | 391 (11%) | 3183 (12%) | 9128 (13%) | |
20-29 Yrs | 364 (10%) | 2995 (11%) | 7246 (10%) | |
30-39 Yrs | 657 (19%) | 3567 (13%) | 8263 (11%) | |
40-49 Yrs | 423 (12%) | 3473 (13%) | 9546 (13%) | |
50-59 Yrs | 467 (13%) | 3823 (14%) | 10792 (15%) | |
60-69 Yrs | 265 (7%) | 3194 (12%) | 8799 (12%) | |
70+ Yrs | 278 (8%) | 2933 (11%) | 8164 (11%) | |
Median HH Income | $87,064 | $71,834 | $80,278 | |
Total Household Income | < 24K | 132 (10%) | 1377 (13%) | 2854 (10%) |
25-49K | 169 (13%) | 2030 (19%) | 4748 (17%) | |
50-74K | 234 (18%) | 2034 (19%) | 4952 (18%) | |
75-99K | 186 (14%) | 1456 (14%) | 3734 (13%) | |
100-199K | 414 (33%) | 2918 (28%) | 8373 (31%) | |
200K+ | 115 (9%) | 573 (5%) | 2023 (7%) | |
Highest Education Level | No Diploma | 70 | 1075 | 2450 |
Diploma or GED | 502 | 5589 | 14224 | |
Some College | 475 | 4495 | 11043 | |
Assoc. Degree | 299 | 2047 | 4679 | |
Bachelors Degree | 575 | 3503 | 11049 | |
Higher Degree | 268 | 1595 | 5521 | |
Total Housing Units | 1,272 | 10,867 | 27,719 | |
--Owner-Occupied | 941 | 7,849 | 21,896 | |
--Renter-Occupied | 308 | 2,538 | 4,789 | |
Owner-Occupied Values | < 100K | 60 | 575 | 1173 |
100-199K | 265 | 3948 | 9980 | |
200-299K | 422 | 2221 | 7155 | |
300-399K | 143 | 736 | 2407 | |
400-499K | 39 | 220 | 684 | |
500K+ | 11 | 149 | 497 | |
Total Working Age Population | 2,590 | 21,230 | 56,301 | |
In Work Force | 2,008 | 14,675 | 38,497 | |
Not In Work Force | 583 | 6,555 | 17,805 | |
Workforce Employed | 1,963 | 14,300 | 37,372 | |
Workforce Unemployed | 44 | 363 | 1,113 | |
Civlian Workforce | 2,008 | 14,663 | 38,485 | |
Military Workforce | 0 | 12 | 12 | |
Total Households | 1,249 | 10,387 | 26,685 | |
Family Households | 934 | 7,022 | 19,110 | |
Non-Family Households | 315 | 3,365 | 7,575 | |
Married Couple | 835 | 5,629 | 15,928 | |
Other Family | 99 | 1,393 | 3,182 | |
Married w/Child | 416 | 2,140 | 6,136 | |
Single Male w/Child | 20 | 177 | 428 | |
Single Female w/Child | 32 | 550 | 1,076 |
Population Change Last Two Decades - Plus Projection
2000 | % | 2010 | % | 2020 | % | 2030 | |
---|---|---|---|---|---|---|---|
Ohio | 11,353,140 | +2 | 11,536,504 | 0 | 11,574,870 | 0 | 11,615,100 |
Cuyahoga County | 1,393,978 | -8 | 1,280,122 | -6 | 1,209,550 | -5 | 1,154,210 |
Lorain County | 284,664 | +6 | 301,356 | +3 | 310,230 | +3 | 320,430 |
Medina County | 151,095 | +14 | 172,332 | +7 | 184,670 | +5 | 194,510 |
Total Working Age Population:
Total Households:
Total Working Age Population:
Total Households:
Total Working Age Population:
Total Households: