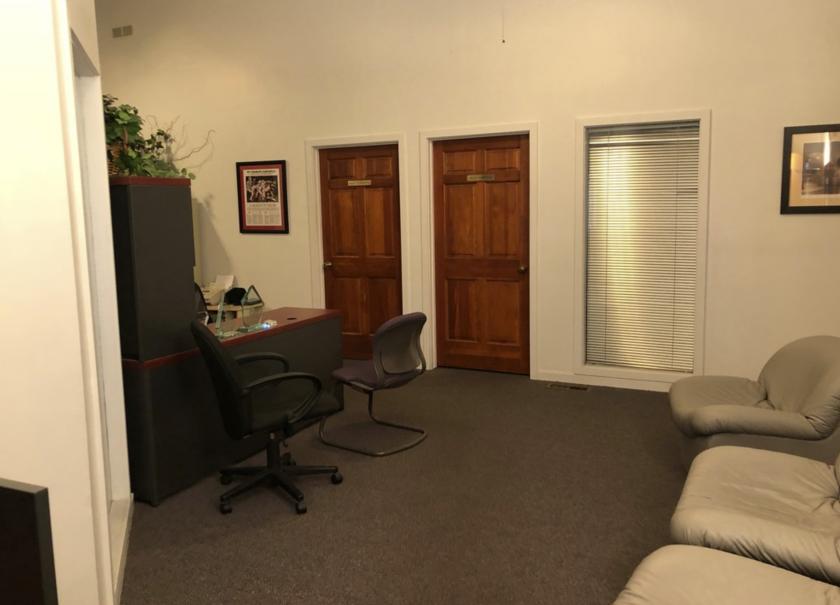
1-Mile | 3-Miles | 5-Miles | ||
---|---|---|---|---|
Total Population | 15,006 | 97,986 | 259,773 | |
Population Median Age | 39 | 39 | 38 | |
Population by Age | 0-9 Yrs | 1602 (10%) | 11730 (11%) | 32278 (12%) |
10-19 Yrs | 1186 (7%) | 9081 (9%) | 26838 (10%) | |
20-29 Yrs | 2845 (18%) | 15958 (16%) | 42128 (16%) | |
30-39 Yrs | 2810 (18%) | 16423 (16%) | 44488 (17%) | |
40-49 Yrs | 1645 (10%) | 11237 (11%) | 32491 (12%) | |
50-59 Yrs | 1762 (11%) | 12399 (12%) | 31263 (12%) | |
60-69 Yrs | 1710 (11%) | 10892 (11%) | 27629 (10%) | |
70+ Yrs | 1445 (9%) | 10266 (10%) | 22659 (8%) | |
Median HH Income | $65,858 | $79,644 | $80,662 | |
Total Household Income | < 24K | 855 (12%) | 4751 (11%) | 13390 (12%) |
25-49K | 1670 (24%) | 7947 (18%) | 19252 (17%) | |
50-74K | 1249 (18%) | 7425 (17%) | 19198 (17%) | |
75-99K | 970 (14%) | 6723 (15%) | 15887 (14%) | |
100-199K | 1327 (19%) | 11319 (26%) | 31037 (27%) | |
200K+ | 621 (9%) | 4579 (10%) | 12113 (10%) | |
Highest Education Level | No Diploma | 547 | 2652 | 6867 |
Diploma or GED | 1937 | 9266 | 24604 | |
Some College | 1960 | 11502 | 29828 | |
Assoc. Degree | 580 | 3929 | 10726 | |
Bachelors Degree | 3685 | 26144 | 66935 | |
Higher Degree | 2556 | 18310 | 46540 | |
Total Housing Units | 7,267 | 45,601 | 118,533 | |
--Owner-Occupied | 3,458 | 24,419 | 64,746 | |
--Renter-Occupied | 3,234 | 18,325 | 46,130 | |
Owner-Occupied Values | < 100K | 301 | 1122 | 3549 |
100-199K | 1543 | 6117 | 17037 | |
200-299K | 688 | 8279 | 21000 | |
300-399K | 250 | 4601 | 11753 | |
400-499K | 195 | 2141 | 5206 | |
500K+ | 481 | 2160 | 6200 | |
Total Working Age Population | 12,659 | 80,461 | 210,521 | |
In Work Force | 9,133 | 57,138 | 152,233 | |
Not In Work Force | 3,526 | 23,323 | 58,288 | |
Workforce Employed | 8,758 | 55,442 | 147,382 | |
Workforce Unemployed | 351 | 1,611 | 4,678 | |
Civlian Workforce | 9,109 | 57,054 | 152,061 | |
Military Workforce | 24 | 85 | 172 | |
Total Households | 6,692 | 42,744 | 110,877 | |
Family Households | 3,212 | 23,925 | 64,060 | |
Non-Family Households | 3,480 | 18,819 | 46,817 | |
Married Couple | 2,448 | 19,264 | 51,504 | |
Other Family | 764 | 4,661 | 12,556 | |
Married w/Child | 1,039 | 8,123 | 22,573 | |
Single Male w/Child | 34 | 625 | 1,899 | |
Single Female w/Child | 253 | 1,660 | 4,963 |
Population Change Last Two Decades - Plus Projection
2000 | % | 2010 | % | 2020 | % | 2030 | |
---|---|---|---|---|---|---|---|
Ohio | 11,353,140 | +2 | 11,536,504 | 0 | 11,574,870 | 0 | 11,615,100 |
Delaware County | 109,989 | +58 | 174,214 | +21 | 210,630 | +17 | 246,000 |
Franklin County | 1,068,978 | +9 | 1,163,414 | +11 | 1,291,320 | +8 | 1,394,980 |
Total Working Age Population:
Total Households:
Total Working Age Population:
Total Households:
Total Working Age Population:
Total Households: