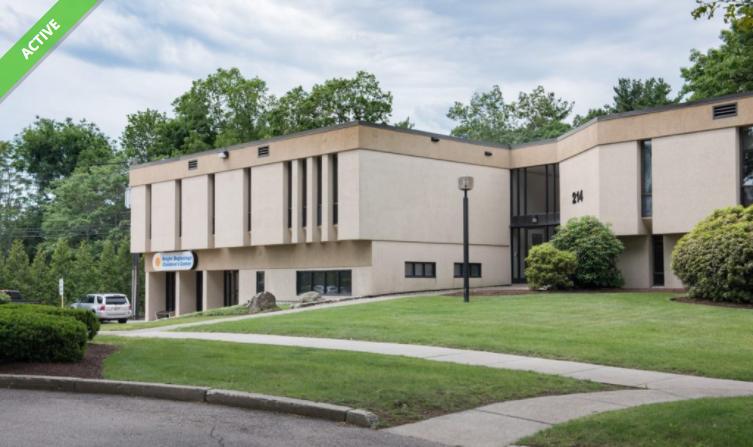
With soon to be updated landscaping and internal common areas, these buildings located on Route 27 at the junction of Route 9 are also ideally situated for easy access from nearby Route 30 or the Massachusetts Turnpike. The property is also a short distance to downtown Natick and the Commuter Rail Station.
There is an on-site daycare center and a dentist. The property has plenty of off-street parking and an outdoor picnic area. Many tenants have been there over a decade. Park-like setting.
Local responsive landlord.
Wonderful amenities and conveniences within walking distance including Staples, Dunkin Donuts, Panera Bread, Five Guys, Super Stop & Shop and a convenience store.
440-975-1,170-1,364-1,849 s.f. suites
RECENTLY LISTED – FORMER PEDIATRIC DENTIST OFFICE – ALL BUILT OUT. JUST BRING FURNITURE. 1,364 sf
No part of this information may be copied, reproduced, repurposed, or screen-captured for any commercial purpose without prior written authorization from MyEListing.
While we strive to provide the most accurate information, all listing information, and demographic data, is provided by third-parties. As such, MyEListing will not be responsible for the accuracy of the information. It is strongly recommended that you verify all information with the listing agent, and any relevant agencies, prior to making any decisions.
What is the building size of this commercial Office property?
The size of this multi-unit property varies between 440 - 1849 square feet
What kind of Office is the propery at 214 North Main Street?
The property at 214 North Main Street Natick, MA 01760 is listed as a Professional Office property
What is the population within 1 mile of 214 North Main Street in Natick?
The population within 1 mile of 214 North Main Street Natick, MA 01760 is 9,054 people.
Who do I contact for questions about 214 North Main Street?
You should contact the listing agent,
Eric Brosler, for any details regarding this commercial listing.