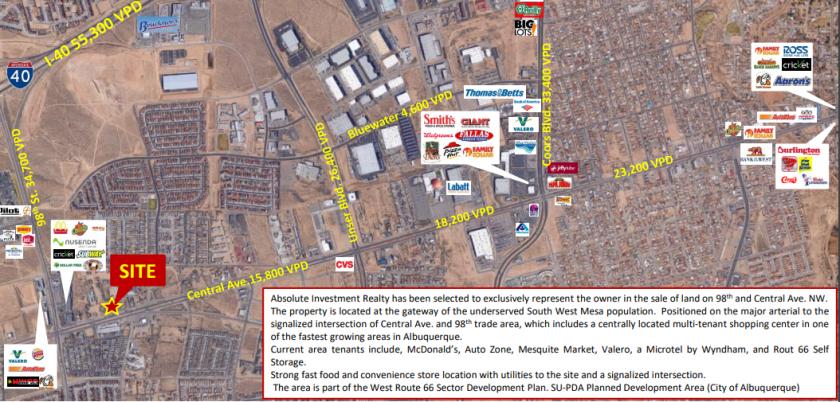
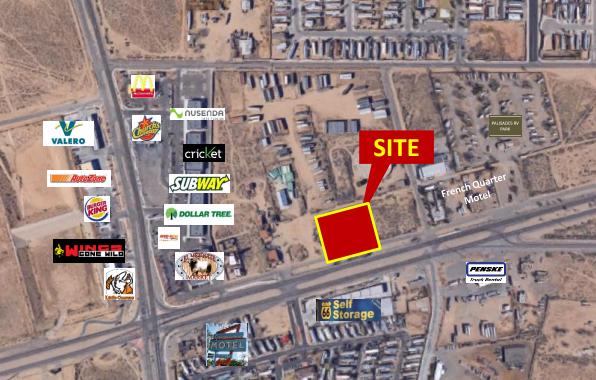
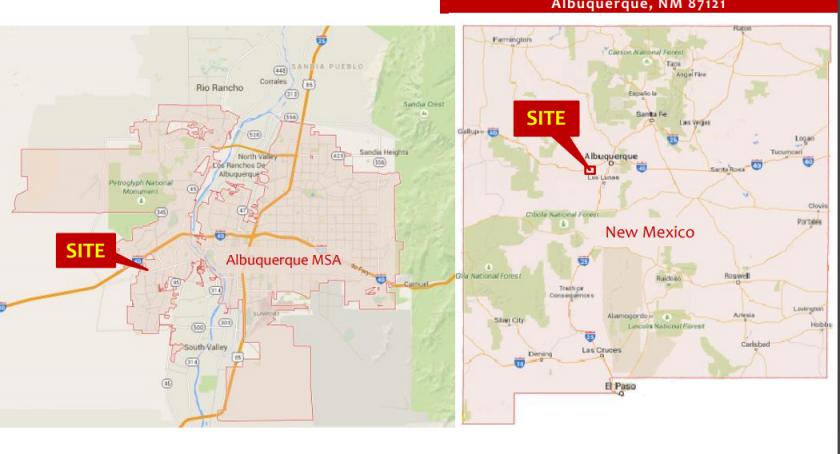
1-Mile | 3-Miles | 5-Miles | ||
---|---|---|---|---|
Total Population | 12,865 | 94,844 | 169,139 | |
Population Median Age | 32 | 33 | 36 | |
Population by Age | 0-9 Yrs | 1686 (13%) | 13698 (14%) | 22272 (13%) |
10-19 Yrs | 2693 (20%) | 16600 (17%) | 26243 (15%) | |
20-29 Yrs | 1763 (13%) | 14933 (15%) | 25613 (15%) | |
30-39 Yrs | 2357 (18%) | 15102 (15%) | 25743 (15%) | |
40-49 Yrs | 1815 (14%) | 11491 (12%) | 20800 (12%) | |
50-59 Yrs | 1359 (10%) | 10583 (11%) | 19832 (11%) | |
60-69 Yrs | 710 (5%) | 7456 (7%) | 16273 (9%) | |
70+ Yrs | 480 (3%) | 4982 (5%) | 12362 (7%) | |
Median HH Income | $45,998 | $48,871 | $46,871 | |
Total Household Income | < 24K | 868 (21%) | 7287 (23%) | 15778 (26%) |
25-49K | 1303 (32%) | 8581 (27%) | 15803 (26%) | |
50-74K | 917 (22%) | 6525 (21%) | 11646 (19%) | |
75-99K | 419 (10%) | 3756 (12%) | 7048 (11%) | |
100-199K | 438 (10%) | 4379 (14%) | 8196 (13%) | |
200K+ | 67 (1%) | 534 (1%) | 1274 (2%) | |
Highest Education Level | No Diploma | 1717 | 11300 | 20418 |
Diploma or GED | 2555 | 19554 | 33957 | |
Some College | 1580 | 13329 | 24019 | |
Assoc. Degree | 847 | 4804 | 9013 | |
Bachelors Degree | 648 | 5829 | 13295 | |
Higher Degree | 208 | 2690 | 7805 | |
Total Housing Units | 4,268 | 33,099 | 65,007 | |
--Owner-Occupied | 3,159 | 22,462 | 40,875 | |
--Renter-Occupied | 854 | 8,601 | 18,871 | |
Owner-Occupied Values | < 100K | 747 | 3740 | 6905 |
100-199K | 2236 | 14886 | 24493 | |
200-299K | 114 | 3128 | 6345 | |
300-399K | 2 | 437 | 1479 | |
400-499K | 0 | 38 | 688 | |
500K+ | 59 | 232 | 964 | |
Total Working Age Population | 9,521 | 70,691 | 130,490 | |
In Work Force | 6,682 | 46,910 | 83,218 | |
Not In Work Force | 2,838 | 23,781 | 47,272 | |
Workforce Employed | 6,352 | 44,603 | 78,232 | |
Workforce Unemployed | 325 | 2,169 | 4,752 | |
Civlian Workforce | 6,678 | 46,772 | 82,984 | |
Military Workforce | 4 | 138 | 235 | |
Total Households | 4,013 | 31,063 | 59,745 | |
Family Households | 2,860 | 21,621 | 38,474 | |
Non-Family Households | 1,153 | 9,442 | 21,271 | |
Married Couple | 1,846 | 12,607 | 22,822 | |
Other Family | 1,014 | 9,014 | 15,653 | |
Married w/Child | 1,091 | 6,289 | 9,718 | |
Single Male w/Child | 119 | 1,378 | 2,186 | |
Single Female w/Child | 437 | 3,794 | 6,392 |
Population Change Last Two Decades - Plus Projection
2000 | % | 2010 | % | 2020 | % | 2030 | |
---|---|---|---|---|---|---|---|
New Mexico | 1,819,046 | +13 | 2,059,179 | +6 | 2,187,183 | +6 | 2,308,475 |
Bernalillo County | 556,678 | +19 | 662,564 | +8 | 715,115 | +7 | 763,571 |
Total Working Age Population:
Total Households:
Total Working Age Population:
Total Households:
Total Working Age Population:
Total Households: