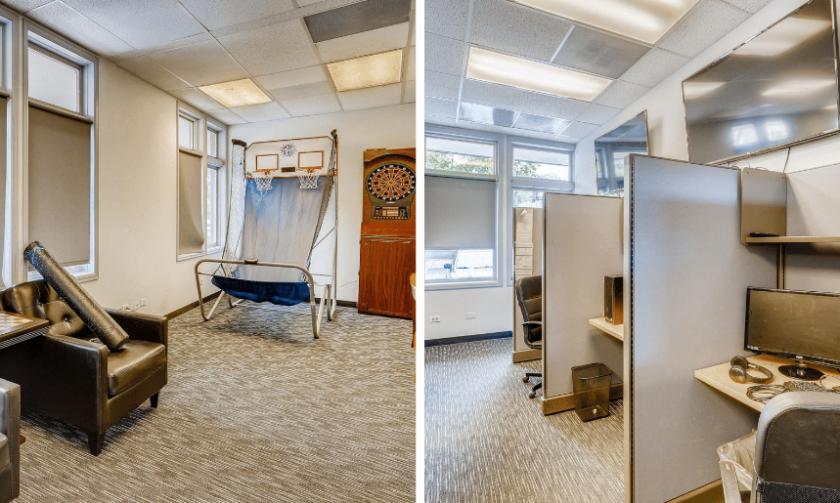
Owner/occupied condo unit. Class A finishes give
this location a great professional setting. The space
offers a fantastic mix of open floor plan, private
offices, and ample natural light throughout. Three
sides of the condo feature the natural light
windowed walls. The building grounds also have
ample parking available. The common areas are
professionally maintained and come along with an
HOA to take care of the exterior.
Location Overview
Great location in South Denver! With the largest
concentration of high-tech corporate workers in
Colorado living and working in Denver South, this
region is redefining industries. The location offers
convenient access to light rail, shopping, dining,
and hotels - making this a very desirable location
for any business
No part of this information may be copied, reproduced, repurposed, or screen-captured for any commercial purpose without prior written authorization from MyEListing.
While we strive to provide the most accurate information, all listing information, and demographic data, is provided by third-parties. As such, MyEListing will not be responsible for the accuracy of the information. It is strongly recommended that you verify all information with the listing agent, and any relevant agencies, prior to making any decisions.
What is the asking price for 3671 South Huron Street in Englewood?
The asking price for 3671 South Huron Street is $540,000
What is the building size of this Office property in Englewood, CO?
The size of the building/unit at 3671 South Huron Street in Englewood is 2,720 square feet
What kind of Office is the propery at 3671 South Huron Street?
The property at 3671 South Huron Street Englewood, CO 80110 is listed as a Professional Office property
What is the population within 1 mile of 3671 South Huron Street in Englewood?
The population within 1 mile of 3671 South Huron Street Englewood, CO 80110 is 12,606 people.
Who do I contact for questions about 3671 South Huron Street?
You should contact the listing agent,
Phil Kubat, for any details regarding this commercial listing.