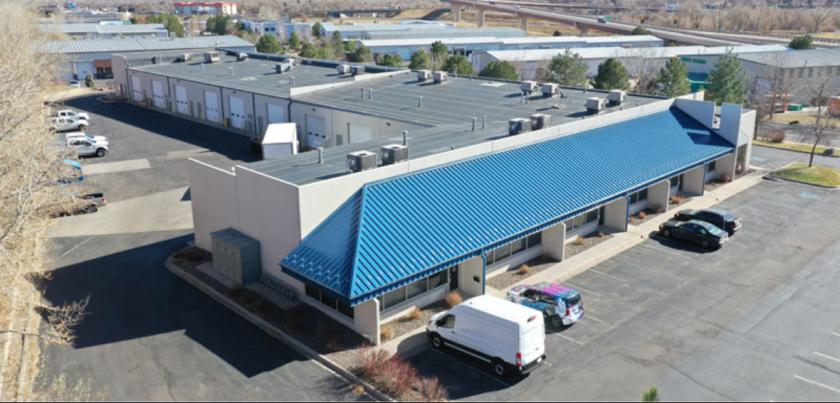
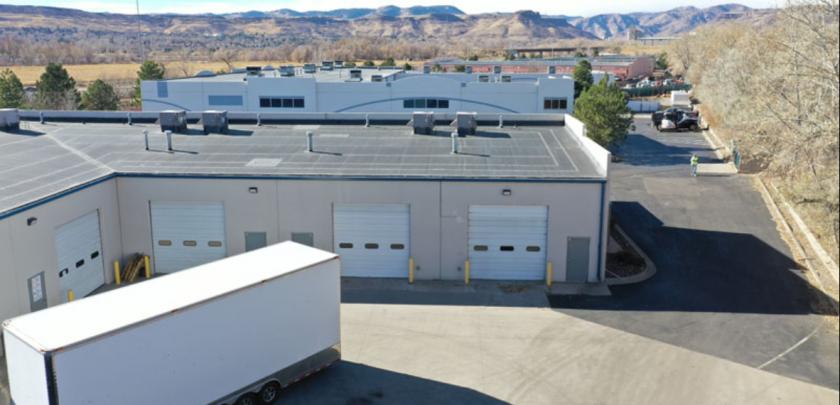
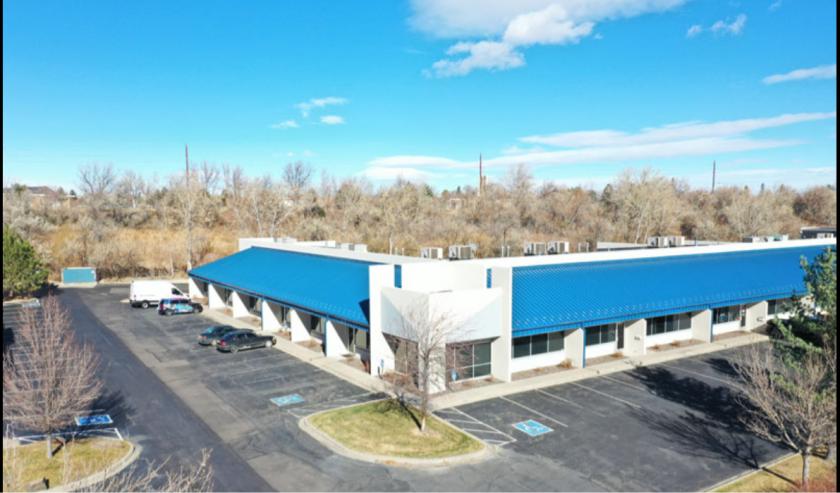
1-Mile | 3-Miles | 5-Miles | ||
---|---|---|---|---|
Total Population | 3,867 | 66,099 | 205,144 | |
Population Median Age | 43 | 42 | 40 | |
Population by Age | 0-9 Yrs | 440 (11%) | 7077 (10%) | 20974 (10%) |
10-19 Yrs | 329 (8%) | 6521 (9%) | 21795 (10%) | |
20-29 Yrs | 369 (9%) | 8256 (12%) | 30426 (14%) | |
30-39 Yrs | 632 (16%) | 9437 (14%) | 31043 (15%) | |
40-49 Yrs | 397 (10%) | 7648 (11%) | 24850 (12%) | |
50-59 Yrs | 599 (15%) | 9881 (14%) | 28409 (13%) | |
60-69 Yrs | 540 (13%) | 8798 (13%) | 24968 (12%) | |
70+ Yrs | 561 (14%) | 8481 (12%) | 22678 (11%) | |
Median HH Income | $86,880 | $79,965 | $73,335 | |
Total Household Income | < 24K | 174 (10%) | 3398 (12%) | 12234 (14%) |
25-49K | 317 (18%) | 5083 (18%) | 16124 (18%) | |
50-74K | 206 (12%) | 4651 (16%) | 15557 (18%) | |
75-99K | 299 (17%) | 4050 (14%) | 11494 (13%) | |
100-199K | 442 (26%) | 7727 (27%) | 22674 (26%) | |
200K+ | 241 (14%) | 2965 (10%) | 7759 (9%) | |
Highest Education Level | No Diploma | 86 | 2756 | 10164 |
Diploma or GED | 783 | 10667 | 33824 | |
Some College | 474 | 10066 | 30468 | |
Assoc. Degree | 300 | 4089 | 11144 | |
Bachelors Degree | 775 | 13262 | 39617 | |
Higher Degree | 551 | 8193 | 23610 | |
Total Housing Units | 1,775 | 28,764 | 89,201 | |
--Owner-Occupied | 1,296 | 18,301 | 52,425 | |
--Renter-Occupied | 382 | 9,574 | 33,417 | |
Owner-Occupied Values | < 100K | 27 | 394 | 1724 |
100-199K | 30 | 814 | 2310 | |
200-299K | 137 | 2384 | 8140 | |
300-399K | 242 | 4241 | 12722 | |
400-499K | 207 | 4011 | 12050 | |
500K+ | 654 | 6457 | 15479 | |
Total Working Age Population | 3,229 | 54,982 | 171,114 | |
In Work Force | 2,115 | 36,873 | 116,246 | |
Not In Work Force | 1,114 | 18,109 | 54,868 | |
Workforce Employed | 2,045 | 35,230 | 111,407 | |
Workforce Unemployed | 69 | 1,614 | 4,775 | |
Civlian Workforce | 2,115 | 36,844 | 116,182 | |
Military Workforce | 0 | 29 | 64 | |
Total Households | 1,679 | 27,875 | 85,842 | |
Family Households | 1,010 | 16,819 | 49,618 | |
Non-Family Households | 668 | 11,056 | 36,224 | |
Married Couple | 801 | 12,959 | 37,834 | |
Other Family | 209 | 3,860 | 11,784 | |
Married w/Child | 310 | 4,762 | 13,921 | |
Single Male w/Child | 10 | 582 | 1,981 | |
Single Female w/Child | 60 | 1,182 | 3,571 |
Population Change Last Two Decades - Plus Projection
2000 | % | 2010 | % | 2020 | % | 2030 | |
---|---|---|---|---|---|---|---|
Colorado | 4,301,261 | +17 | 5,029,196 | +16 | 5,838,181 | +15 | 6,733,658 |
Denver County | 554,636 | +8 | 600,158 | +23 | 738,611 | +12 | 827,681 |
Jefferson County | 527,056 | +1 | 534,543 | +10 | 587,118 | +7 | 626,742 |
Total Working Age Population:
Total Households:
Total Working Age Population:
Total Households:
Total Working Age Population:
Total Households: