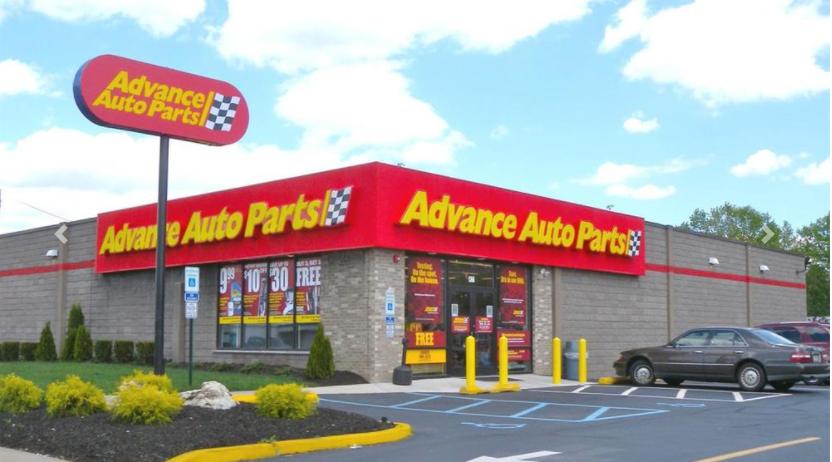
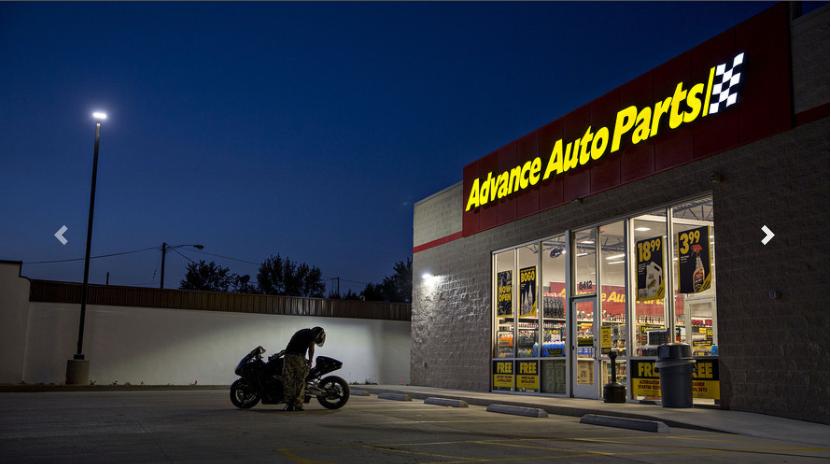
SVN Chicago Commercial is pleased to provide this opportunity to acquire a 7,000 square foot free standing Advance Auto Parts. This free standing site is on a 1.37 acre parcel located at 1551 South Township, Pittston, PA. This investment offers approximately eight (8) years remaining on a new year five year extension. Advance Auto Parts has been operating at this location since 2001. The lease contains two, five year options.
Highlights
Eight years remaining on NN Lease
Two five year options
Largest Automotive Parts Retailer
Do It Yourself Consumers – This store is located in a market that supports high retail sales for auto parts
Double-Net Lease with Minimal Landlord Responsibilities
Committed to early 5-year renewal
Long term tenancy commitment - 20 years
Largest Automotive Parts Retailer
Corporate Guarantee Lease
Advance Auto Parts Has Investment Grade Credit: S&P BBB
No part of this information may be copied, reproduced, repurposed, or screen-captured for any commercial purpose without prior written authorization from MyEListing.
While we strive to provide the most accurate information, all listing information, and demographic data, is provided by third-parties. As such, MyEListing will not be responsible for the accuracy of the information. It is strongly recommended that you verify all information with the listing agent, and any relevant agencies, prior to making any decisions.
What is the asking price for 1551 South Township Boulevard in Pittston?
The asking price for 1551 South Township Boulevard is $810,000
What is the building size of this Retail property in Pittston, PA?
The size of the building/unit at 1551 South Township Boulevard in Pittston is 7,000 square feet
How much land does the Pittston, PA property at 1551 South Township Boulevard include?
1551 South Township Boulevard in Pittston includes 1.370 acres of land
What kind of Retail is the propery at 1551 South Township Boulevard?
The property at 1551 South Township Boulevard Pittston, PA 18640 is listed as a Free Standing Building Retail property
What is the population within 1 mile of 1551 South Township Boulevard in Pittston?
The population within 1 mile of 1551 South Township Boulevard Pittston, PA 18640 is 7,594 people.
Who do I contact for questions about 1551 South Township Boulevard?
You should contact the listing agent,
Matthew McParland, for any details regarding this commercial listing.