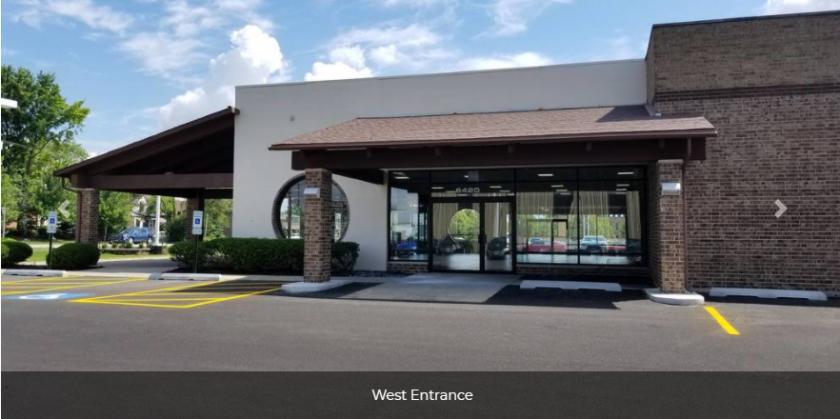
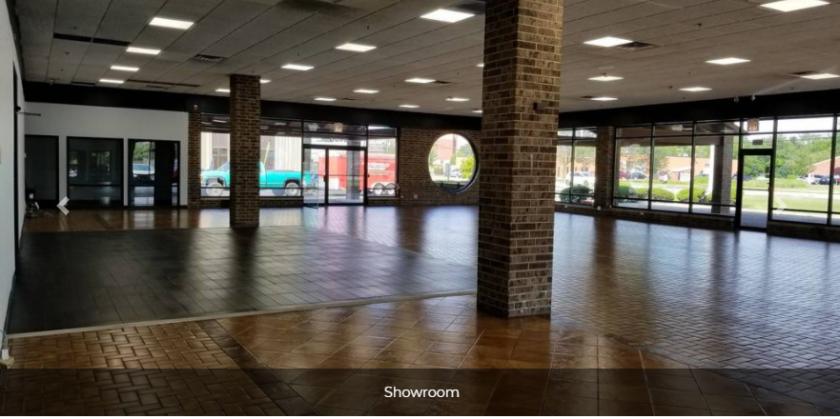
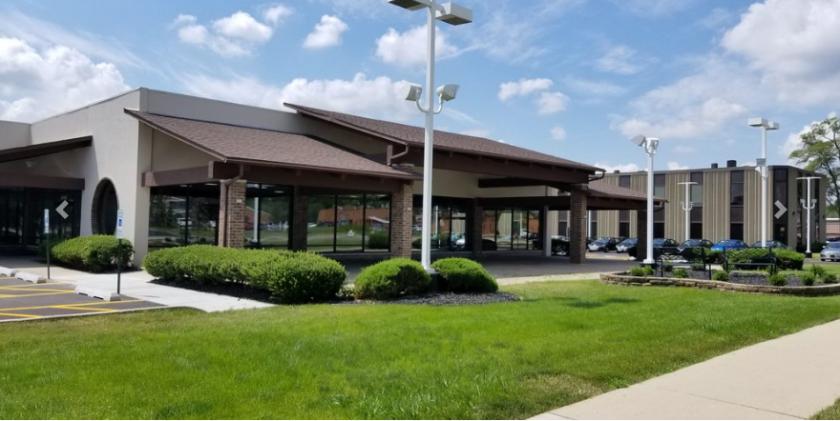
1-Mile | 3-Miles | 5-Miles | ||
---|---|---|---|---|
Total Population | 7,238 | 63,597 | 235,244 | |
Population Median Age | 48 | 41 | 40 | |
Population by Age | 0-9 Yrs | 518 (7%) | 8032 (12%) | 31087 (13%) |
10-19 Yrs | 782 (10%) | 9002 (14%) | 32855 (13%) | |
20-29 Yrs | 479 (6%) | 4683 (7%) | 22017 (9%) | |
30-39 Yrs | 777 (10%) | 7212 (11%) | 29744 (12%) | |
40-49 Yrs | 788 (10%) | 8466 (13%) | 30550 (12%) | |
50-59 Yrs | 1246 (17%) | 9396 (14%) | 34010 (14%) | |
60-69 Yrs | 1147 (15%) | 8502 (13%) | 28033 (11%) | |
70+ Yrs | 1501 (20%) | 8304 (13%) | 26949 (11%) | |
Median HH Income | $75,383 | $104,458 | $86,400 | |
Total Household Income | < 24K | 423 (12%) | 2502 (10%) | 11544 (13%) |
25-49K | 698 (21%) | 3375 (14%) | 14280 (16%) | |
50-74K | 523 (15%) | 2887 (12%) | 12434 (14%) | |
75-99K | 457 (13%) | 2523 (10%) | 10808 (12%) | |
100-199K | 819 (24%) | 6087 (26%) | 22480 (26%) | |
200K+ | 382 (11%) | 6016 (25%) | 14828 (17%) | |
Highest Education Level | No Diploma | 258 | 2861 | 13542 |
Diploma or GED | 1362 | 8230 | 34603 | |
Some College | 1114 | 6872 | 28535 | |
Assoc. Degree | 352 | 2325 | 11316 | |
Bachelors Degree | 1717 | 13012 | 41245 | |
Higher Degree | 910 | 10832 | 31756 | |
Total Housing Units | 3,387 | 24,773 | 92,644 | |
--Owner-Occupied | 2,618 | 19,627 | 65,324 | |
--Renter-Occupied | 684 | 3,764 | 21,051 | |
Owner-Occupied Values | < 100K | 276 | 1500 | 3886 |
100-199K | 656 | 2252 | 12014 | |
200-299K | 620 | 3048 | 16243 | |
300-399K | 551 | 2811 | 10147 | |
400-499K | 201 | 2074 | 5485 | |
500K+ | 314 | 7941 | 17549 | |
Total Working Age Population | 6,190 | 49,574 | 183,500 | |
In Work Force | 3,652 | 30,759 | 117,766 | |
Not In Work Force | 2,537 | 18,815 | 65,733 | |
Workforce Employed | 3,422 | 29,551 | 112,590 | |
Workforce Unemployed | 230 | 1,208 | 5,163 | |
Civlian Workforce | 3,652 | 30,759 | 117,753 | |
Military Workforce | 0 | 0 | 13 | |
Total Households | 3,302 | 23,391 | 86,375 | |
Family Households | 1,964 | 17,022 | 60,619 | |
Non-Family Households | 1,338 | 6,369 | 25,755 | |
Married Couple | 1,439 | 14,068 | 47,787 | |
Other Family | 525 | 2,954 | 12,832 | |
Married w/Child | 479 | 5,994 | 21,044 | |
Single Male w/Child | 74 | 335 | 1,635 | |
Single Female w/Child | 122 | 1,020 | 4,835 |
Population Change Last Two Decades - Plus Projection
2000 | % | 2010 | % | 2020 | % | 2030 | |
---|---|---|---|---|---|---|---|
Illinois | 12,419,293 | +3 | 12,830,632 | +12 | 14,316,487 | +6 | 15,138,849 |
Cook County | 5,376,741 | -3 | 5,194,675 | +10 | 5,707,832 | +5 | 5,990,243 |
DuPage County | 904,161 | +1 | 916,924 | +10 | 1,010,323 | +2 | 1,034,039 |
Will County | 502,266 | +35 | 677,560 | +34 | 907,625 | +20 | 1,093,207 |
Total Working Age Population:
Total Households:
Total Working Age Population:
Total Households:
Total Working Age Population:
Total Households: