Industrial Properties
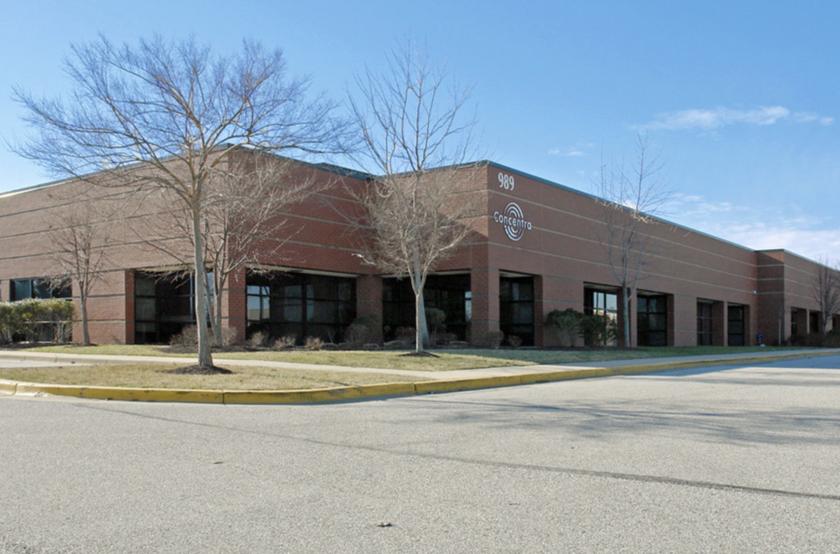
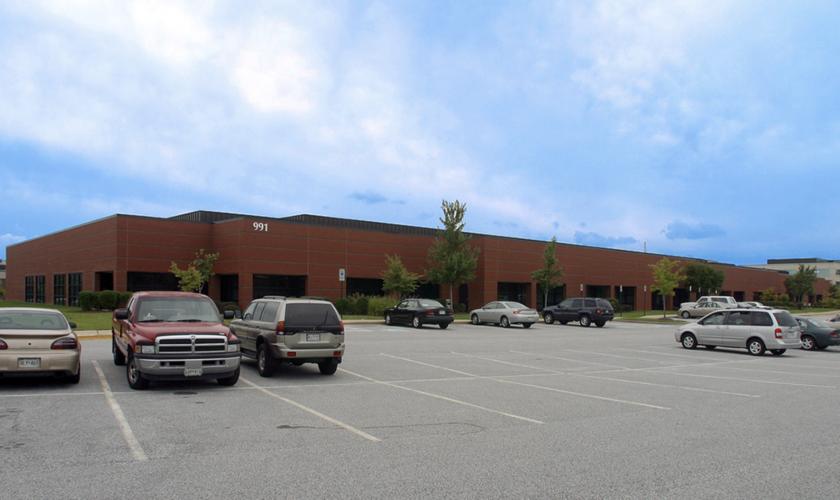
991 Corporate Boulevard, 989-991 Linthicum Heights, MD 21090
991 Corporate Boulevard, 989-991 Linthicum Heights, MD 21090
Details & Description
Listing Agents

Chris Bennett
O: 443-573-3200
M: 410-953-0352
cbennett@mackenziecommercial.com
O: 443-573-3200
M: 410-953-0352
cbennett@mackenziecommercial.com
While we strive to provide the most accurate information, all listing information, and demographic data, is provided by third-parties. As such, MyEListing will not be responsible for the accuracy of the information. It is strongly recommended that you verify all information with the listing agent, and any relevant agencies, prior to making any decisions.