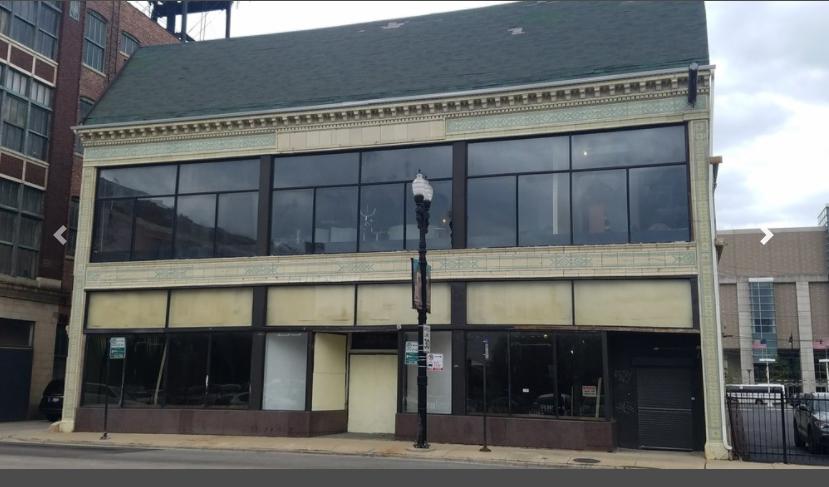
Huge price reduction!!! SVN Chicago Commercial is pleased to present The Colby Building - a historic landmark property in the middle of Chicago's Motor Row Historic District. Adjacent to Chicago's vibrant South Loop/McCormick Square area, and located within steps to the new Wintrust Arena, this approx. 18,000 SF building sits in the closest Opportunity Zone to downtown Chicago. The longtime home of Lesly Motors, the property's DS-5 zoning will allow for additional sq. footage to be added to the property. With landmark status, any re-development of the property not only is eligible for Opportunity Zone tax benefits but also has the possibility of historic tax credits. The site has potential for mixed-use, hotel/hospitality, office, or retail/restaurant uses. One of the best locations in Chicago.
Highlights
$300,000 Price Reduction
Approx. 18,000 SF land-marked building in Chicago's Motor Row Historic District
Located in one of the best Opportunity Zones in the US
Adjacent to McCormick Place, Chicago's South Loop neighborhood and other points of interest
DS-5 Zoning allows for additional sq. footage to be added to the building
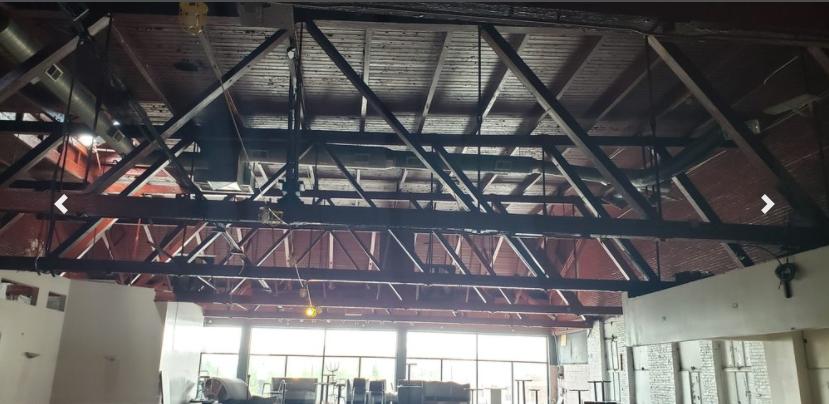
Expansive, high ceilings on the 2nd floor of the property
Located adjacent to McCormick Place & the new Wintrust Arena & Chicago's vibrant South Loop neighborhood
Steps to thousands of area residents and hotel rooms
Blocks from new CTA Green Line station at Cermak, and proximate to all expressways
Many possible uses including hospitality, office, mixed-use, retail & restaurant
Opportunity for historic tax credits as part of re-development and renovation
No part of this information may be copied, reproduced, repurposed, or screen-captured for any commercial purpose without prior written authorization from MyEListing.
While we strive to provide the most accurate information, all listing information, and demographic data, is provided by third-parties. As such, MyEListing will not be responsible for the accuracy of the information. It is strongly recommended that you verify all information with the listing agent, and any relevant agencies, prior to making any decisions.
What is the asking price for 2347 South Michigan Avenue in Chicago?
The asking price for 2347 South Michigan Avenue is $1,650,000
What is the building size of this Retail property in Chicago, IL?
The size of the building/unit at 2347 South Michigan Avenue in Chicago is 18,000 square feet
How much land does the Chicago, IL property at 2347 South Michigan Avenue include?
2347 South Michigan Avenue in Chicago includes 0.190 acres of land
What kind of Retail is the propery at 2347 South Michigan Avenue?
The property at 2347 South Michigan Avenue Chicago, IL 60616 is listed as a Free Standing Building Retail property
What is the population within 1 mile of 2347 South Michigan Avenue in Chicago?
The population within 1 mile of 2347 South Michigan Avenue Chicago, IL 60616 is 40,406 people.
Who do I contact for questions about 2347 South Michigan Avenue?
You should contact the listing agent,
Wayne Caplan, for any details regarding this commercial listing.