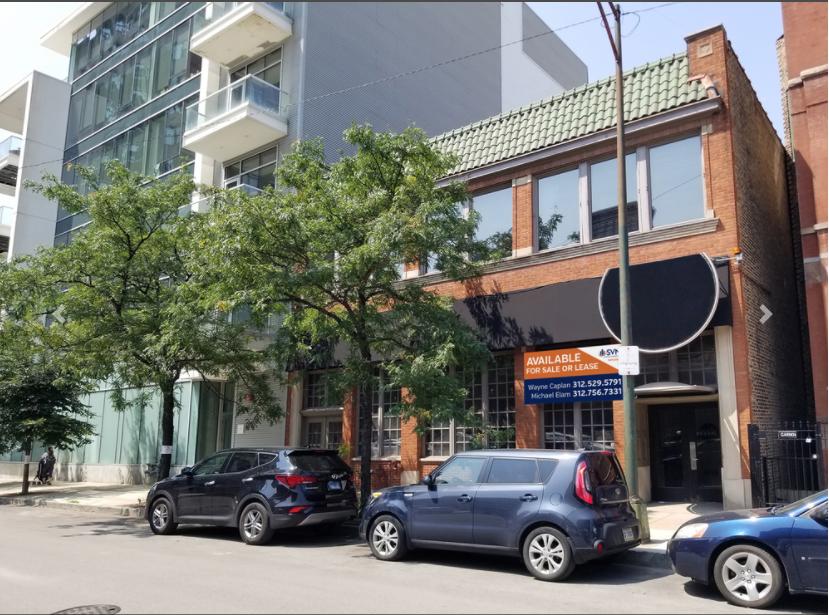
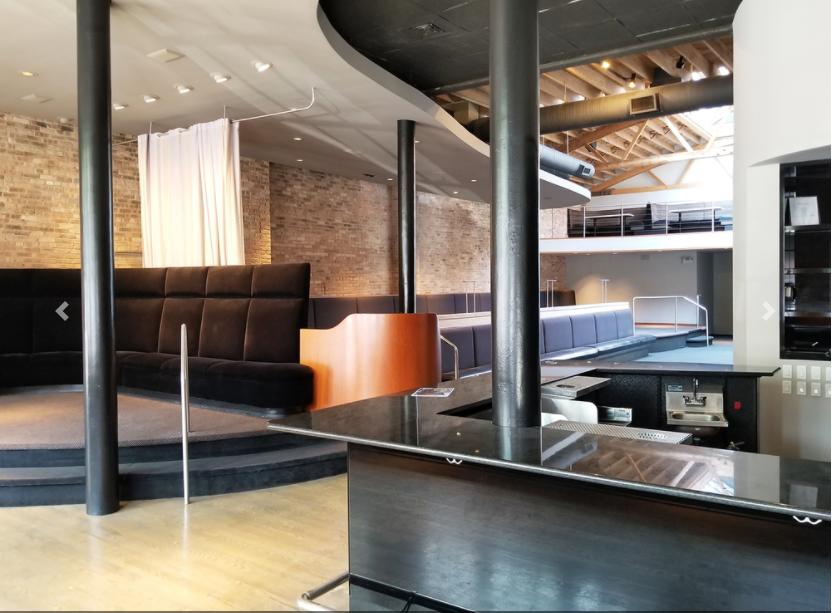
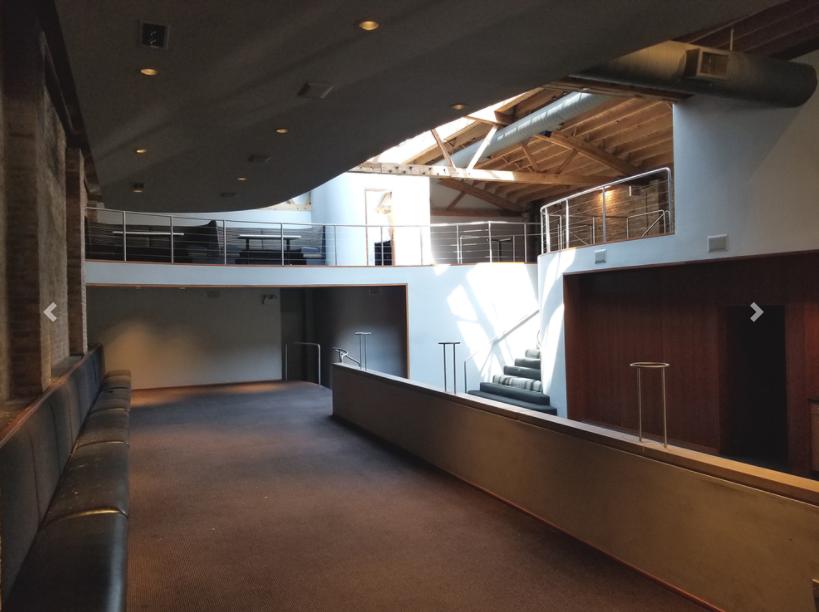
SVN | Chicago Commercial is pleased to present this very unique former restaurant building in Chicago's red-hot River North neighborhood that offers substantial land and air rights for development and adding to its value. This property consists of approximately 5,715 square feet at and above grade along with a 3,874 square foot full-height lower level. The building has both a mezzanine level and a second level providing even more floor space. This dynamic space features soaring ceilings with a bow truss roof in the main area, a massive skylight, exposed brick and timber beams throughout, two upscale ADA restrooms, and the potential for outdoor seating. The property lends itself perfectly for a wide variety of uses including a restaurant (substantial infrastructure is already in place), nightclub, entertainment venue, banquet hall, office space, medical offices, salon, spa, fitness, gallery, showroom, childcare, or school…just to name a few.
The property also has substantial development value as the existing C1-5 zoning allows for an approximately 24,000 square foot building to be constructed on-site without any zoning relief. Additionally, the site is located in a designated Transit Oriented Development (TOD) zone, allowing for substantially decreased parking requirements for new residential / mixed-use developments. Very favorable assumable financing is also available on this asset.
Highlights
Approximately 9,589 SF Total (5,715 SF Between the Ground and Second Levels and 3,874 SF in the Lower Level)
For Sale at $2,995,000 - Also Available for Lease
Fantastic Assumable Financing Available
Perfect Location for a Variety of Uses Such as Restaurant (Substantial Infrastructure in Place), Nightclub, Entertainment
Venue, Banquet Hall, Office Space, Medical Offices, Salon, Spa, Fitness, Gallery, Showroom, Childcare, School, or Others
Existing C1-5 Zoning Allows for Approximately 24,000 SF of New Building Without Zoning Relief
Located in a Designated TOD Area for New Developments, Allowing for Minimal Parking Requirements
Fantastic Location in Chicago's Hot River North Neighborhood
3 Blocks From the CTA Brown and Purple Lines Chicago Avenue Station