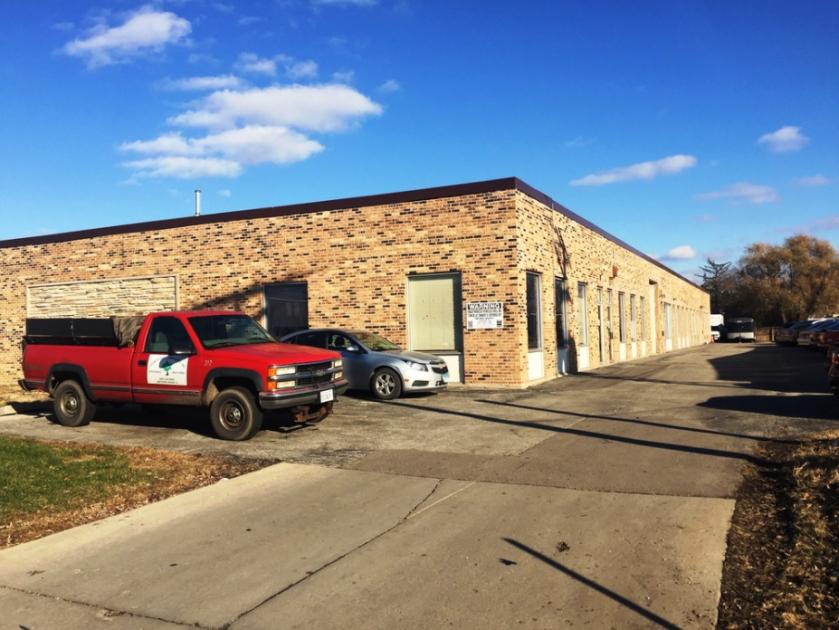
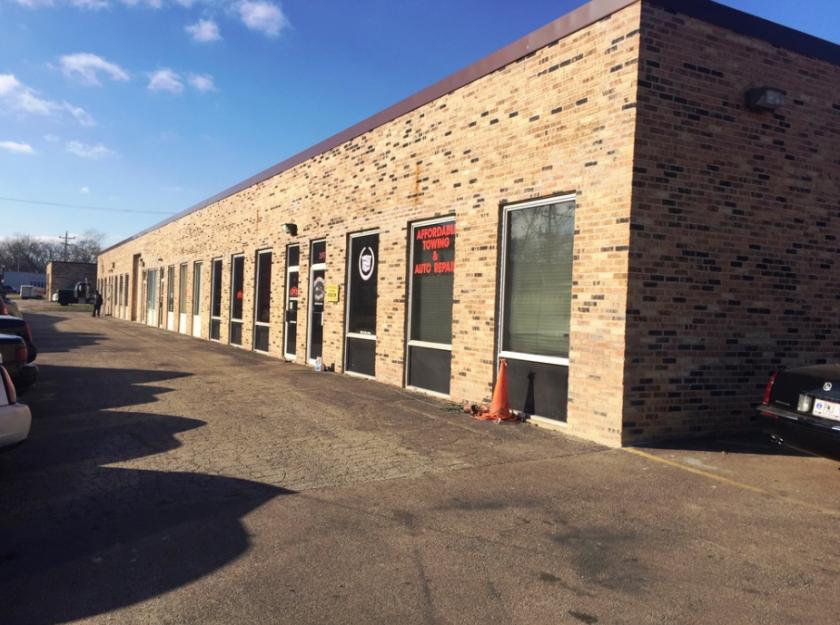
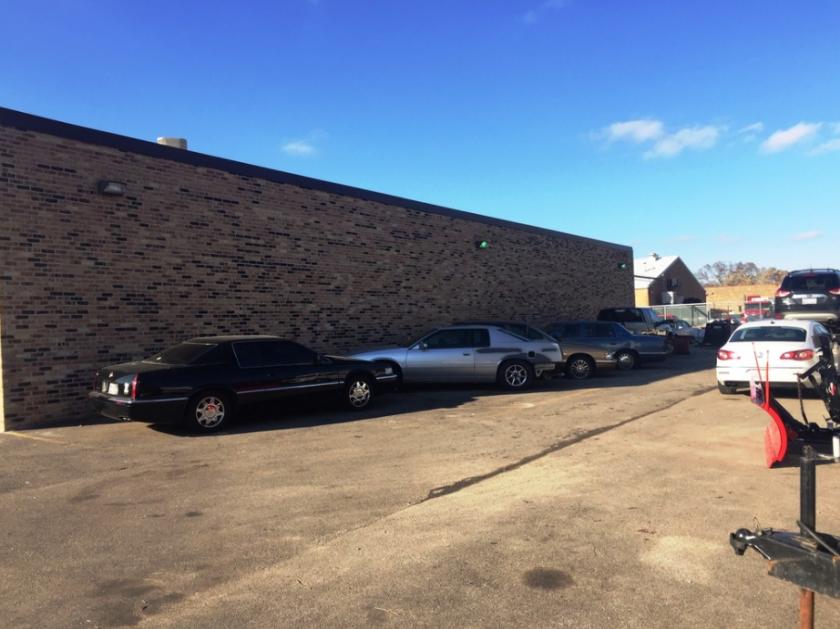
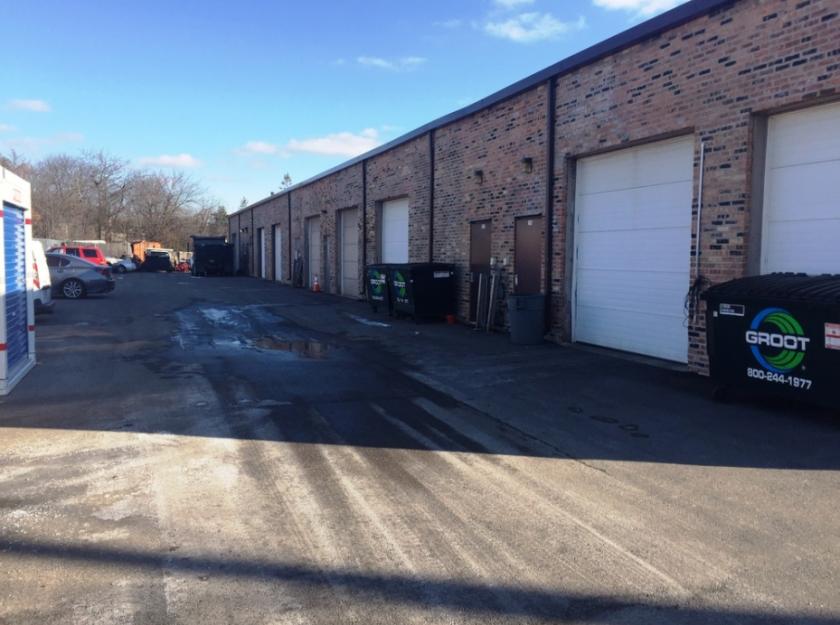
1-Mile | 3-Miles | 5-Miles | ||
---|---|---|---|---|
Total Population | 12,335 | 98,307 | 232,262 | |
Population Median Age | 42 | 39 | 39 | |
Population by Age | 0-9 Yrs | 1466 (11%) | 12865 (13%) | 30451 (13%) |
10-19 Yrs | 1184 (9%) | 11499 (11%) | 27668 (11%) | |
20-29 Yrs | 1227 (9%) | 10836 (11%) | 24040 (10%) | |
30-39 Yrs | 1727 (14%) | 14498 (14%) | 33531 (14%) | |
40-49 Yrs | 1866 (15%) | 13623 (13%) | 31875 (13%) | |
50-59 Yrs | 1879 (15%) | 14159 (14%) | 33387 (14%) | |
60-69 Yrs | 1498 (12%) | 11018 (11%) | 27460 (11%) | |
70+ Yrs | 1488 (12%) | 9808 (9%) | 23849 (10%) | |
Median HH Income | $89,931 | $89,693 | $95,704 | |
Total Household Income | < 24K | 585 (10%) | 3973 (10%) | 8766 (9%) |
25-49K | 875 (15%) | 6420 (16%) | 12779 (14%) | |
50-74K | 878 (15%) | 5985 (15%) | 13303 (15%) | |
75-99K | 780 (13%) | 4683 (12%) | 11364 (12%) | |
100-199K | 1723 (30%) | 11761 (30%) | 27999 (31%) | |
200K+ | 766 (13%) | 5439 (14%) | 14309 (16%) | |
Highest Education Level | No Diploma | 502 | 5840 | 11754 |
Diploma or GED | 1432 | 11233 | 25277 | |
Some College | 1655 | 12072 | 26666 | |
Assoc. Degree | 578 | 4954 | 11567 | |
Bachelors Degree | 3183 | 22369 | 54501 | |
Higher Degree | 2005 | 13444 | 34829 | |
Total Housing Units | 5,957 | 40,345 | 93,313 | |
--Owner-Occupied | 4,048 | 26,859 | 64,573 | |
--Renter-Occupied | 1,559 | 11,400 | 23,946 | |
Owner-Occupied Values | < 100K | 252 | 1613 | 3297 |
100-199K | 629 | 4516 | 9565 | |
200-299K | 1397 | 6638 | 14586 | |
300-399K | 952 | 6116 | 15068 | |
400-499K | 394 | 3422 | 9464 | |
500K+ | 424 | 4554 | 12594 | |
Total Working Age Population | 10,092 | 77,808 | 183,766 | |
In Work Force | 7,333 | 56,042 | 128,846 | |
Not In Work Force | 2,759 | 21,766 | 54,920 | |
Workforce Employed | 7,040 | 54,153 | 124,590 | |
Workforce Unemployed | 279 | 1,846 | 4,178 | |
Civlian Workforce | 7,319 | 55,999 | 128,768 | |
Military Workforce | 14 | 43 | 78 | |
Total Households | 5,608 | 38,259 | 88,519 | |
Family Households | 3,035 | 25,489 | 61,242 | |
Non-Family Households | 2,573 | 12,770 | 27,277 | |
Married Couple | 2,542 | 20,619 | 51,234 | |
Other Family | 493 | 4,870 | 10,008 | |
Married w/Child | 945 | 8,746 | 22,119 | |
Single Male w/Child | 48 | 526 | 1,122 | |
Single Female w/Child | 221 | 1,870 | 3,605 |
Population Change Last Two Decades - Plus Projection
2000 | % | 2010 | % | 2020 | % | 2030 | |
---|---|---|---|---|---|---|---|
Illinois | 12,419,293 | +3 | 12,830,632 | +12 | 14,316,487 | +6 | 15,138,849 |
Cook County | 5,376,741 | -3 | 5,194,675 | +10 | 5,707,832 | +5 | 5,990,243 |
Lake County | 644,356 | +9 | 703,462 | +17 | 820,250 | +6 | 873,024 |
Total Working Age Population:
Total Households:
Total Working Age Population:
Total Households:
Total Working Age Population:
Total Households: