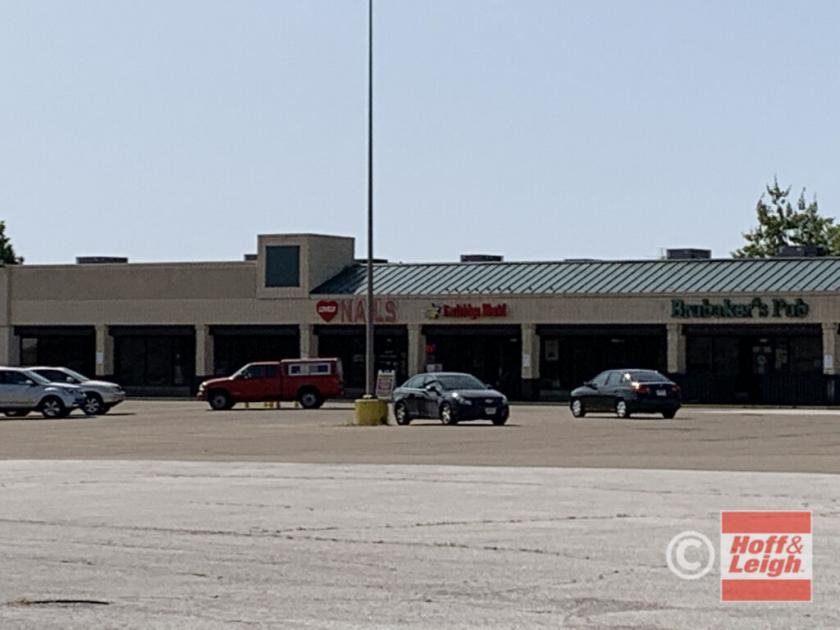
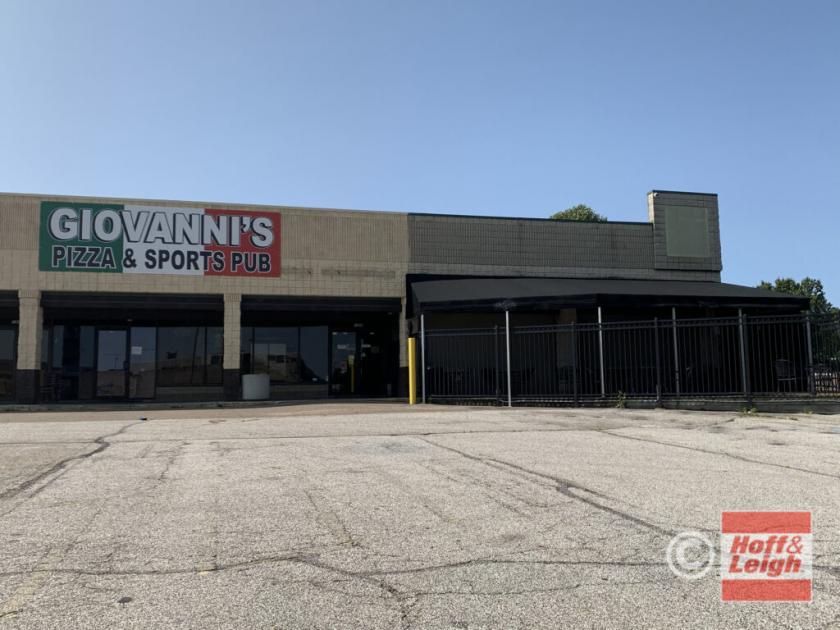
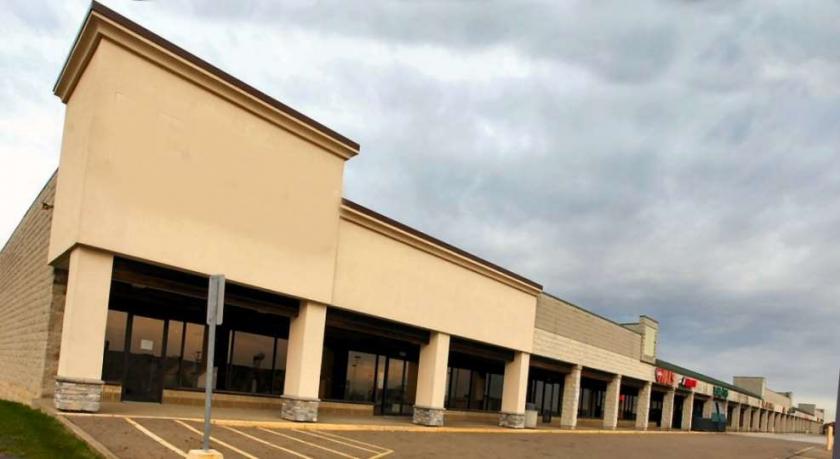
1-Mile | 3-Miles | 5-Miles | ||
---|---|---|---|---|
Total Population | 9,896 | 91,227 | 214,731 | |
Population Median Age | 41 | 40 | 39 | |
Population by Age | 0-9 Yrs | 1015 (10%) | 10678 (11%) | 23556 (10%) |
10-19 Yrs | 903 (9%) | 10084 (11%) | 26273 (12%) | |
20-29 Yrs | 1557 (15%) | 13468 (14%) | 34927 (16%) | |
30-39 Yrs | 1622 (16%) | 12751 (13%) | 27909 (12%) | |
40-49 Yrs | 1242 (12%) | 11286 (12%) | 24556 (11%) | |
50-59 Yrs | 1138 (11%) | 11671 (12%) | 27884 (12%) | |
60-69 Yrs | 1154 (11%) | 11397 (12%) | 25895 (12%) | |
70+ Yrs | 1265 (12%) | 9891 (10%) | 23731 (11%) | |
Median HH Income | $39,892 | $48,944 | $47,916 | |
Total Household Income | < 24K | 1425 (30%) | 9420 (24%) | 23231 (25%) |
25-49K | 1430 (30%) | 10366 (26%) | 24059 (26%) | |
50-74K | 883 (18%) | 7581 (19%) | 16706 (18%) | |
75-99K | 452 (9%) | 4916 (12%) | 10875 (11%) | |
100-199K | 526 (11%) | 5675 (14%) | 13672 (15%) | |
200K+ | 27 (0%) | 771 (1%) | 2504 (2%) | |
Highest Education Level | No Diploma | 1019 | 7694 | 15076 |
Diploma or GED | 2529 | 21350 | 45716 | |
Some College | 1433 | 13401 | 32171 | |
Assoc. Degree | 672 | 5543 | 12370 | |
Bachelors Degree | 1056 | 11680 | 28438 | |
Higher Degree | 512 | 5347 | 14410 | |
Total Housing Units | 5,065 | 42,001 | 101,304 | |
--Owner-Occupied | 1,885 | 21,973 | 50,600 | |
--Renter-Occupied | 2,859 | 16,757 | 40,447 | |
Owner-Occupied Values | < 100K | 907 | 9003 | 19727 |
100-199K | 887 | 10772 | 22076 | |
200-299K | 73 | 1568 | 6062 | |
300-399K | 7 | 368 | 1638 | |
400-499K | 2 | 83 | 521 | |
500K+ | 8 | 180 | 577 | |
Total Working Age Population | 8,375 | 74,718 | 176,639 | |
In Work Force | 5,084 | 47,818 | 112,821 | |
Not In Work Force | 3,291 | 26,899 | 63,817 | |
Workforce Employed | 4,810 | 45,506 | 105,860 | |
Workforce Unemployed | 251 | 2,270 | 6,858 | |
Civlian Workforce | 5,062 | 47,776 | 112,718 | |
Military Workforce | 23 | 42 | 103 | |
Total Households | 4,743 | 38,729 | 91,048 | |
Family Households | 2,248 | 21,907 | 50,458 | |
Non-Family Households | 2,496 | 16,822 | 40,590 | |
Married Couple | 1,496 | 15,319 | 33,334 | |
Other Family | 751 | 6,588 | 17,124 | |
Married w/Child | 528 | 5,691 | 11,605 | |
Single Male w/Child | 43 | 757 | 1,990 | |
Single Female w/Child | 294 | 2,600 | 7,225 |
Population Change Last Two Decades - Plus Projection
2000 | % | 2010 | % | 2020 | % | 2030 | |
---|---|---|---|---|---|---|---|
Ohio | 11,353,140 | +2 | 11,536,504 | 0 | 11,574,870 | 0 | 11,615,100 |
Portage County | 152,061 | +6 | 161,419 | 0 | 161,410 | -2 | 158,930 |
Summit County | 542,899 | 0 | 541,781 | -1 | 534,150 | -1 | 528,990 |
Total Working Age Population:
Total Households:
Total Working Age Population:
Total Households:
Total Working Age Population:
Total Households: