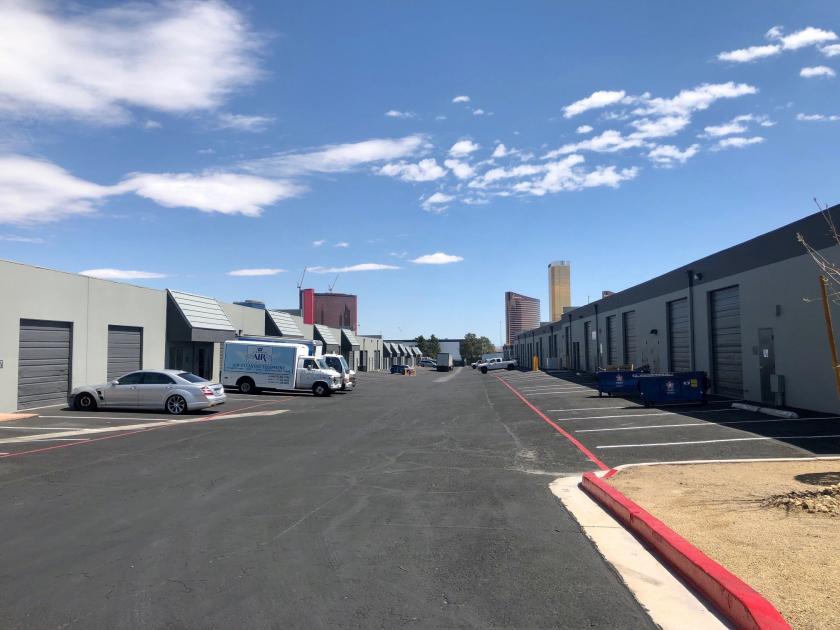
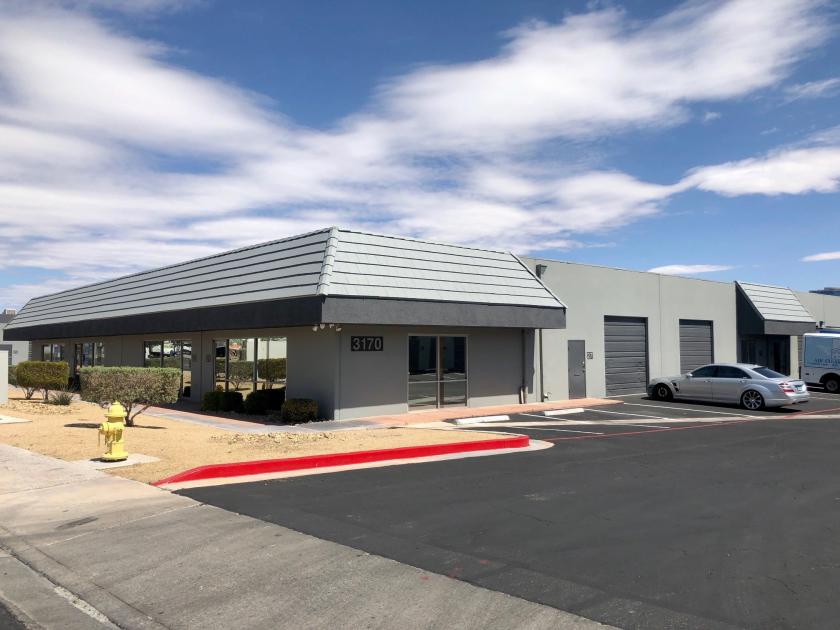
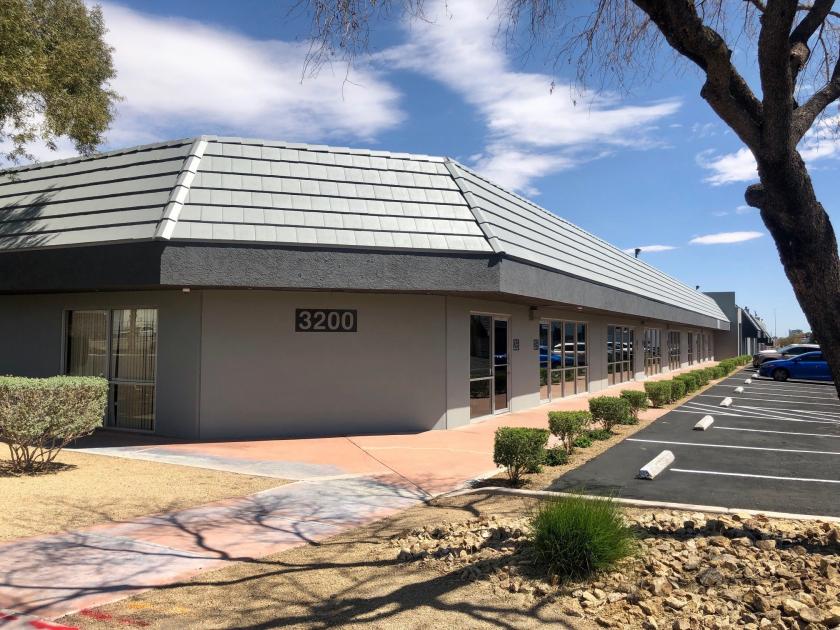
1-Mile | 3-Miles | 5-Miles | ||
---|---|---|---|---|
Total Population | 22,075 | 149,256 | 426,476 | |
Population Median Age | 35 | 38 | 38 | |
Population by Age | 0-9 Yrs | 3581 (16%) | 17463 (11%) | 51074 (11%) |
10-19 Yrs | 3035 (13%) | 16662 (11%) | 50186 (11%) | |
20-29 Yrs | 3280 (14%) | 24155 (16%) | 66295 (15%) | |
30-39 Yrs | 2796 (12%) | 22731 (15%) | 62135 (14%) | |
40-49 Yrs | 3524 (15%) | 19970 (13%) | 56803 (13%) | |
50-59 Yrs | 2393 (10%) | 18749 (12%) | 56508 (13%) | |
60-69 Yrs | 1883 (8%) | 15637 (10%) | 44430 (10%) | |
70+ Yrs | 1584 (7%) | 13888 (9%) | 39046 (9%) | |
Median HH Income | $33,249 | $38,727 | $40,393 | |
Total Household Income | < 24K | 3313 (37%) | 18772 (30%) | 48280 (29%) |
25-49K | 2885 (32%) | 18971 (31%) | 49030 (30%) | |
50-74K | 1527 (17%) | 10173 (16%) | 27930 (17%) | |
75-99K | 545 (6%) | 5618 (9%) | 16169 (9%) | |
100-199K | 454 (5%) | 5720 (9%) | 16624 (10%) | |
200K+ | 73 (0%) | 1832 (2%) | 4252 (2%) | |
Highest Education Level | No Diploma | 3991 | 22261 | 61272 |
Diploma or GED | 4918 | 31648 | 92835 | |
Some College | 2591 | 23915 | 69177 | |
Assoc. Degree | 756 | 6600 | 18931 | |
Bachelors Degree | 1227 | 13405 | 35812 | |
Higher Degree | 407 | 6209 | 16322 | |
Total Housing Units | 11,116 | 83,810 | 200,785 | |
--Owner-Occupied | 1,217 | 16,486 | 55,441 | |
--Renter-Occupied | 7,582 | 44,599 | 106,844 | |
Owner-Occupied Values | < 100K | 562 | 3199 | 8298 |
100-199K | 395 | 5083 | 20150 | |
200-299K | 157 | 3778 | 15417 | |
300-399K | 61 | 1910 | 5046 | |
400-499K | 12 | 1007 | 2427 | |
500K+ | 29 | 1510 | 4104 | |
Total Working Age Population | 16,490 | 121,232 | 344,234 | |
In Work Force | 11,185 | 78,653 | 219,235 | |
Not In Work Force | 5,305 | 42,579 | 124,999 | |
Workforce Employed | 10,459 | 72,550 | 201,402 | |
Workforce Unemployed | 711 | 6,029 | 17,632 | |
Civlian Workforce | 11,170 | 78,579 | 219,034 | |
Military Workforce | 15 | 74 | 201 | |
Total Households | 8,798 | 61,085 | 162,285 | |
Family Households | 4,438 | 30,210 | 86,159 | |
Non-Family Households | 4,360 | 30,875 | 76,127 | |
Married Couple | 1,913 | 16,767 | 48,986 | |
Other Family | 2,526 | 13,443 | 37,173 | |
Married w/Child | 1,003 | 6,332 | 18,973 | |
Single Male w/Child | 315 | 1,807 | 4,980 | |
Single Female w/Child | 1,280 | 5,026 | 12,913 |
Population Change Last Two Decades - Plus Projection
2000 | % | 2010 | % | 2020 | % | 2030 | |
---|---|---|---|---|---|---|---|
Nevada | 1,998,257 | +35 | 2,700,551 | +17 | 3,149,234 | +10 | 3,460,728 |
Clark County | 1,375,765 | +42 | 1,951,269 | +19 | 2,318,174 | +10 | 2,550,048 |
Nye County | 32,485 | +35 | 43,946 | +11 | 48,864 | +8 | 52,587 |
Total Working Age Population:
Total Households:
Total Working Age Population:
Total Households:
Total Working Age Population:
Total Households: