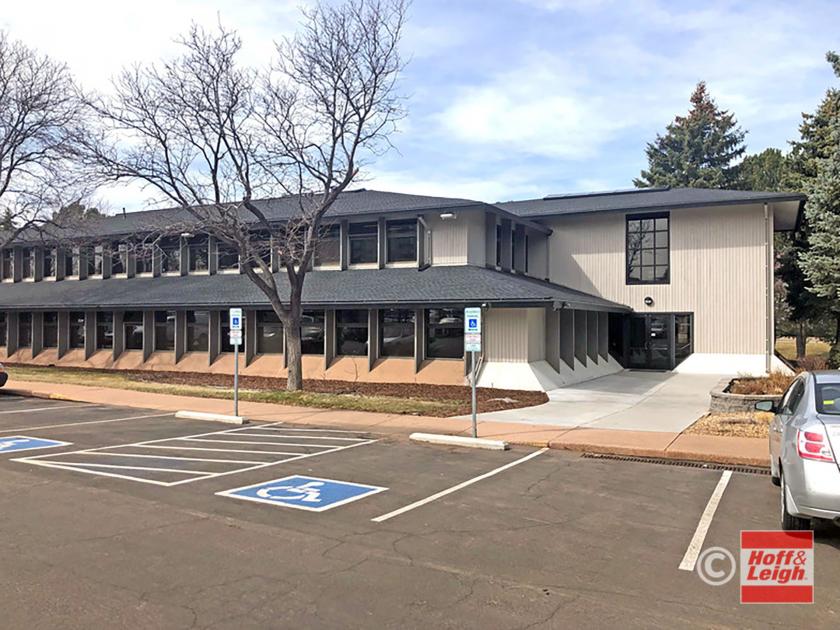
1-Mile | 3-Miles | 5-Miles | ||
---|---|---|---|---|
Total Population | 9,645 | 99,560 | 295,265 | |
Population Median Age | 38 | 40 | 39 | |
Population by Age | 0-9 Yrs | 701 (7%) | 11096 (11%) | 33174 (11%) |
10-19 Yrs | 708 (7%) | 11336 (11%) | 32967 (11%) | |
20-29 Yrs | 2433 (25%) | 13365 (13%) | 43419 (14%) | |
30-39 Yrs | 2008 (20%) | 14623 (14%) | 44038 (14%) | |
40-49 Yrs | 1129 (11%) | 14267 (14%) | 39768 (13%) | |
50-59 Yrs | 1033 (10%) | 12154 (12%) | 36534 (12%) | |
60-69 Yrs | 863 (8%) | 12015 (12%) | 34482 (11%) | |
70+ Yrs | 770 (7%) | 10704 (10%) | 30882 (10%) | |
Median HH Income | $87,463 | $90,824 | $80,883 | |
Total Household Income | < 24K | 585 (11%) | 4094 (9%) | 14660 (11%) |
25-49K | 621 (12%) | 6410 (15%) | 22222 (17%) | |
50-74K | 878 (17%) | 7475 (17%) | 21608 (17%) | |
75-99K | 855 (17%) | 5206 (12%) | 16363 (13%) | |
100-199K | 1587 (31%) | 12257 (28%) | 33803 (27%) | |
200K+ | 495 (9%) | 7108 (16%) | 16025 (12%) | |
Highest Education Level | No Diploma | 84 | 1966 | 9031 |
Diploma or GED | 605 | 8000 | 30118 | |
Some College | 1161 | 12086 | 39842 | |
Assoc. Degree | 246 | 4237 | 14411 | |
Bachelors Degree | 3298 | 26997 | 71894 | |
Higher Degree | 2114 | 18899 | 46328 | |
Total Housing Units | 5,686 | 44,952 | 131,804 | |
--Owner-Occupied | 1,318 | 25,502 | 72,498 | |
--Renter-Occupied | 3,704 | 17,047 | 52,182 | |
Owner-Occupied Values | < 100K | 24 | 499 | 1714 |
100-199K | 2 | 1402 | 5182 | |
200-299K | 40 | 2482 | 10212 | |
300-399K | 213 | 3936 | 14425 | |
400-499K | 305 | 5574 | 15577 | |
500K+ | 734 | 11610 | 25387 | |
Total Working Age Population | 8,551 | 81,191 | 241,319 | |
In Work Force | 6,367 | 57,002 | 169,973 | |
Not In Work Force | 2,183 | 24,189 | 71,346 | |
Workforce Employed | 6,157 | 55,156 | 163,787 | |
Workforce Unemployed | 201 | 1,766 | 5,918 | |
Civlian Workforce | 6,358 | 56,922 | 169,705 | |
Military Workforce | 9 | 80 | 269 | |
Total Households | 5,023 | 42,550 | 124,680 | |
Family Households | 2,196 | 25,347 | 72,435 | |
Non-Family Households | 2,827 | 17,203 | 52,245 | |
Married Couple | 1,828 | 20,877 | 56,200 | |
Other Family | 368 | 4,470 | 16,235 | |
Married w/Child | 596 | 8,938 | 23,250 | |
Single Male w/Child | 93 | 693 | 2,571 | |
Single Female w/Child | 47 | 1,484 | 5,976 |
Population Change Last Two Decades - Plus Projection
2000 | % | 2010 | % | 2020 | % | 2030 | |
---|---|---|---|---|---|---|---|
Colorado | 4,301,261 | +17 | 5,029,196 | +16 | 5,838,181 | +15 | 6,733,658 |
Arapahoe County | 487,967 | +17 | 572,003 | +16 | 662,304 | +13 | 750,773 |
Denver County | 554,636 | +8 | 600,158 | +23 | 738,611 | +12 | 827,681 |
Douglas County | 175,766 | +62 | 285,465 | +23 | 350,161 | +16 | 405,087 |
Total Working Age Population:
Total Households:
Total Working Age Population:
Total Households:
Total Working Age Population:
Total Households: