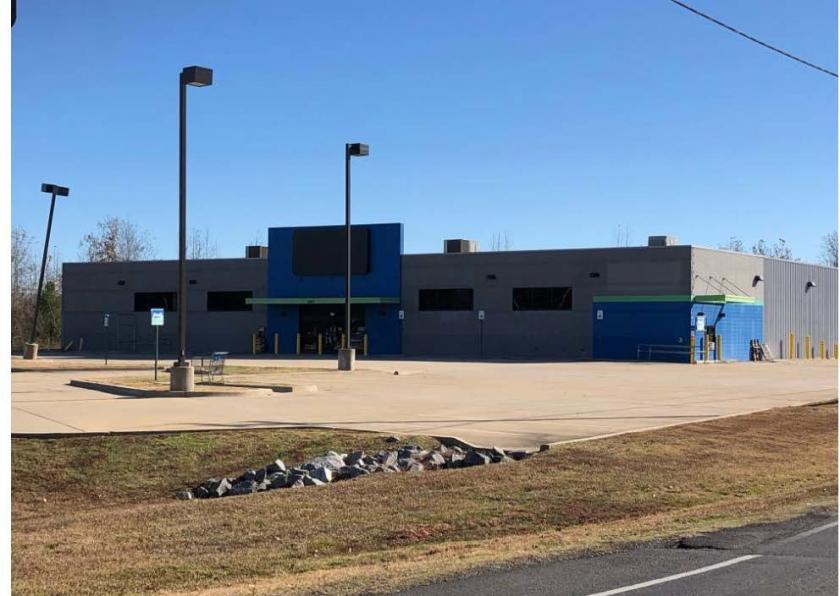
Former Fred's Available for Lease in Blanchard, LA
16,675 sf (145' x 115') built in 2013
1.55 acres with 50 parking spaces
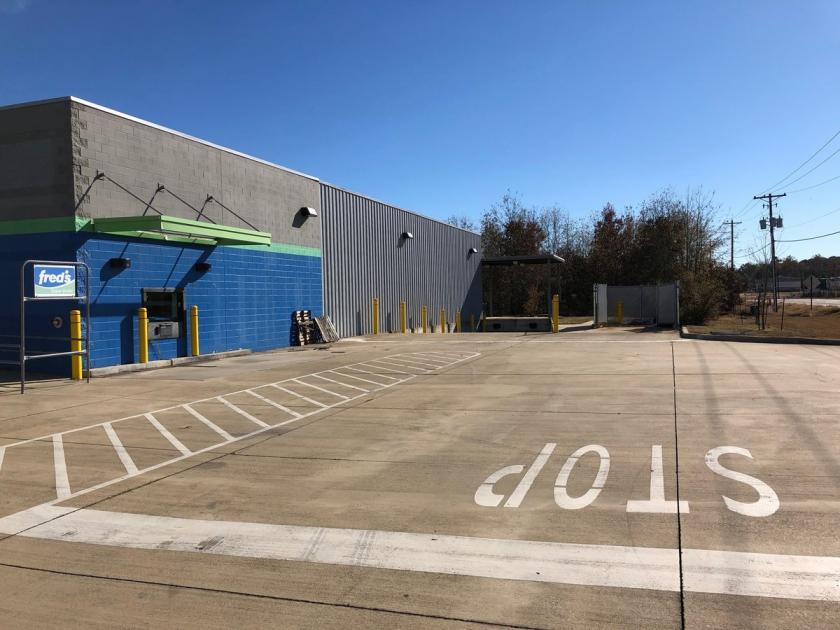
Truck well w/ 750 sf. +/- shipping/receiving area
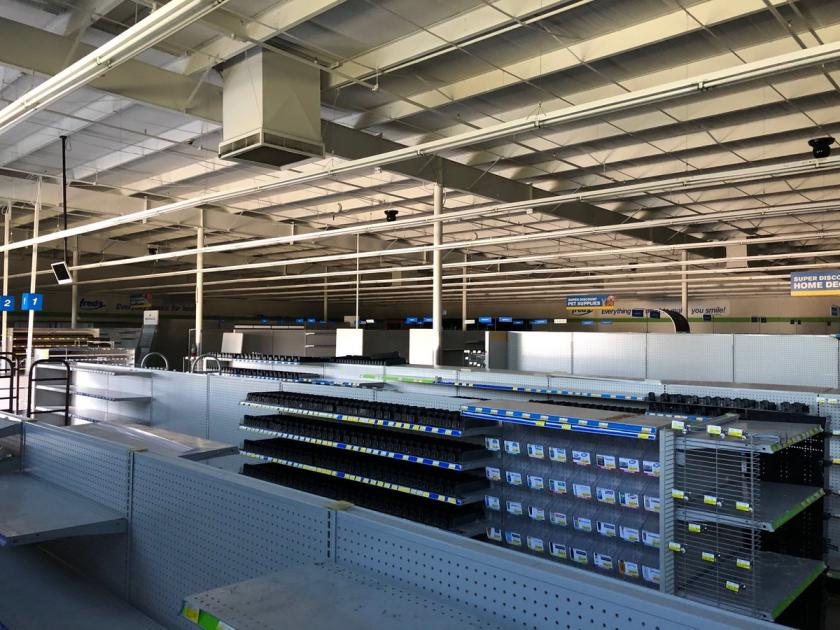
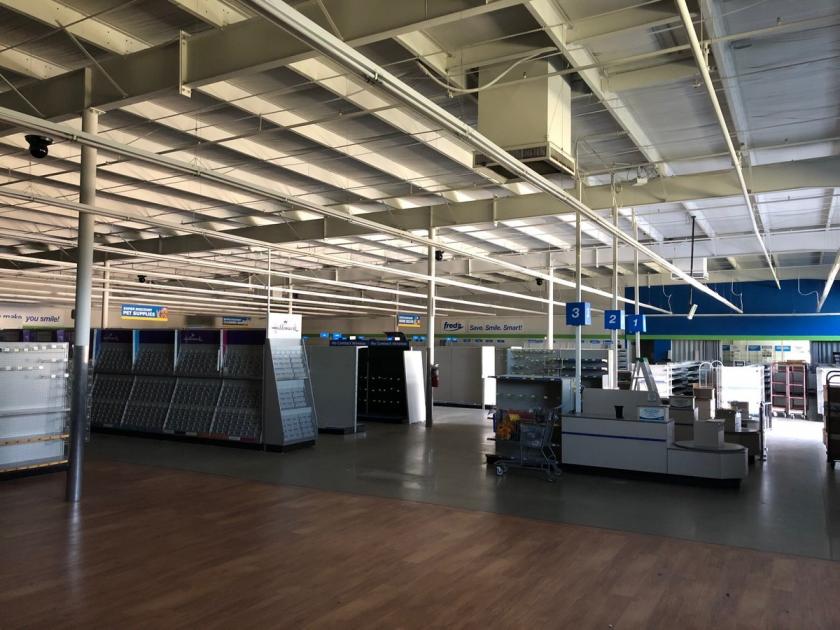
17'-18' Ceiling heights / Fully Sprinklered
Located in Blanchard, LA (6 miles North of Shreveport, CBD),
Less than 1 mile North of exit I-49 & LA Hwy 1
No part of this information may be copied, reproduced, repurposed, or screen-captured for any commercial purpose without prior written authorization from MyEListing.
While we strive to provide the most accurate information, all listing information, and demographic data, is provided by third-parties. As such, MyEListing will not be responsible for the accuracy of the information. It is strongly recommended that you verify all information with the listing agent, and any relevant agencies, prior to making any decisions.
What is the asking price for 5907 Old Mooringsport Road in Shreveport?
The asking price for 5907 Old Mooringsport Road is $7.55 a SF per Year
What is the building size of this commercial Retail property?
The size of this lease property at '.5907 Old Mooringsport Road.' is 16675 square feet
What kind of Retail is the propery at 5907 Old Mooringsport Road?
The property at 5907 Old Mooringsport Road Shreveport, LA 71107 is listed as a Free Standing Building Retail property
What is the population within 1 mile of 5907 Old Mooringsport Road in Shreveport?
The population within 1 mile of 5907 Old Mooringsport Road Shreveport, LA 71107 is 1,438 people.
Who do I contact for questions about 5907 Old Mooringsport Road?
You should contact the listing agent,
Archer Frierson, for any details regarding this commercial listing.