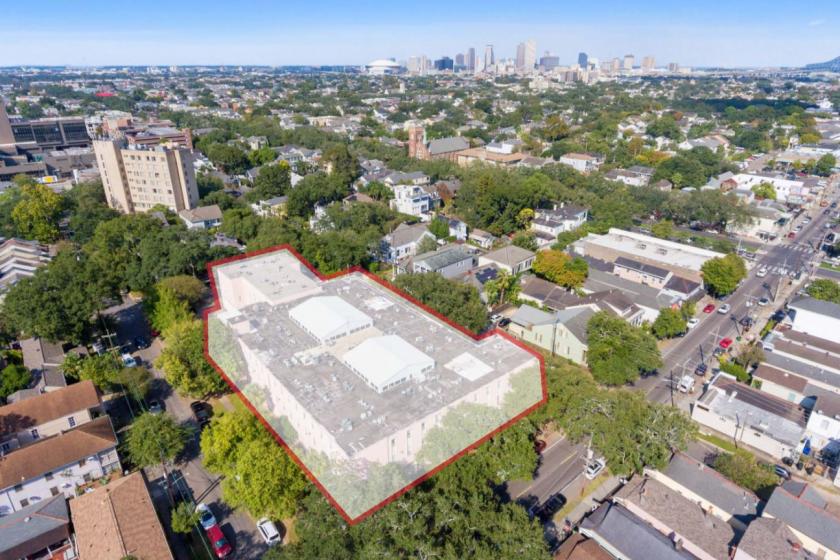
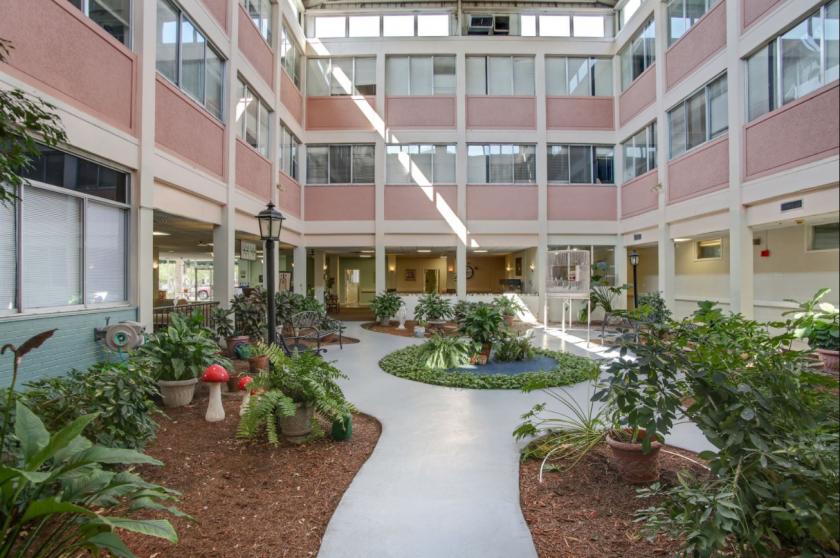
Originally constructed as a convent in 1950, this three-story 74,836 square-foot historic building currently operates as an assisted living facility known as Homelife in the Gardens which is comprised of 95 licensed units, offering independent, assisted, memory and respite care options.In addition to the 95 units, the property includes two passenger elevators, five stairwells, a reception area and lobby, numerous community gathering areas, a dining hall, full commercial kitchen, multiple offices and meeting rooms, and a chapel. There are two large atrium areas that might allow for additional floor plates on the 2nd and 3rd floors, potentially resulting in over 7,000 SF of additional gross building area, allowing for potentially up to approximately 82,000 square feet of gross building area. The improvements are situated on a 45,478 SF site which encompasses an entire city block. Presently there are twenty-seven (27) off-street parking spaces, with room within well spaced columns on the first floor for additional enclosed parking.Strategically positioned in the heart of Uptown New Orleans, this location boasts 162 feet of frontage along Magazine Street, only one block from Louisiana Avenue. Some of the immediately surrounding land uses include Touro Hospital – LCMC Health, CVS Pharmacy, Fresh Market, countless restaurants and destination retail shopping options that all service a demographic base with some of the highest average household income figures in the State of Louisiana.This incredible and once in a career development opportunity presents tremendous potential for conversion to high density residential development, commercial space activation along Magazine Street, or continued use as a senior living facility. The facility has tremendous physique with full service systems and extensive atrium space with beautiful natural light.