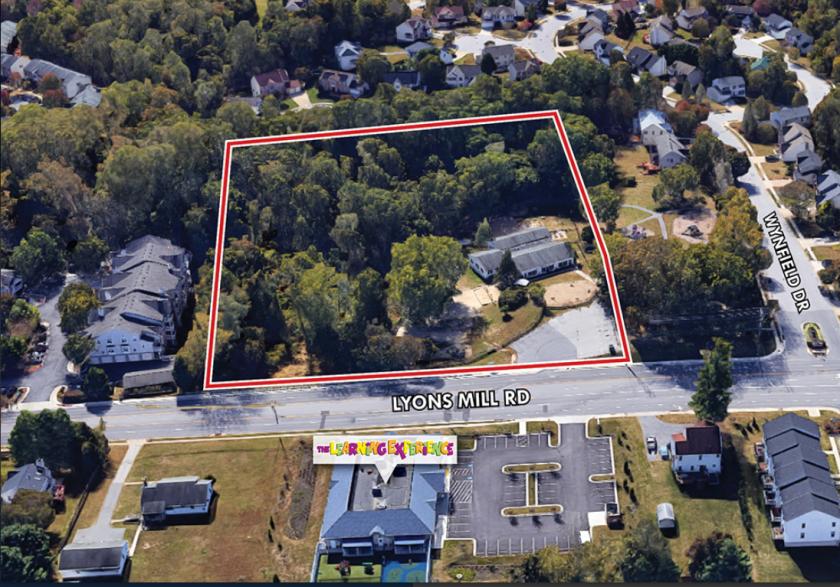
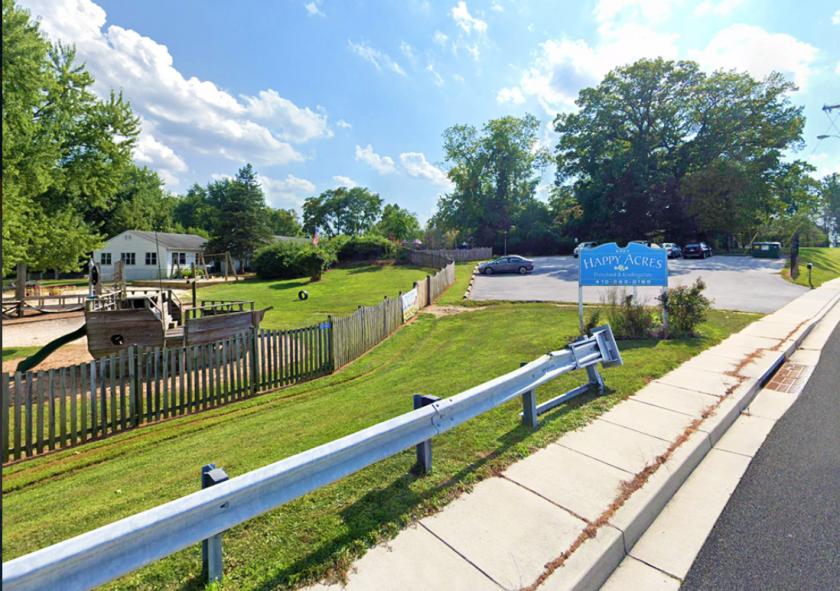
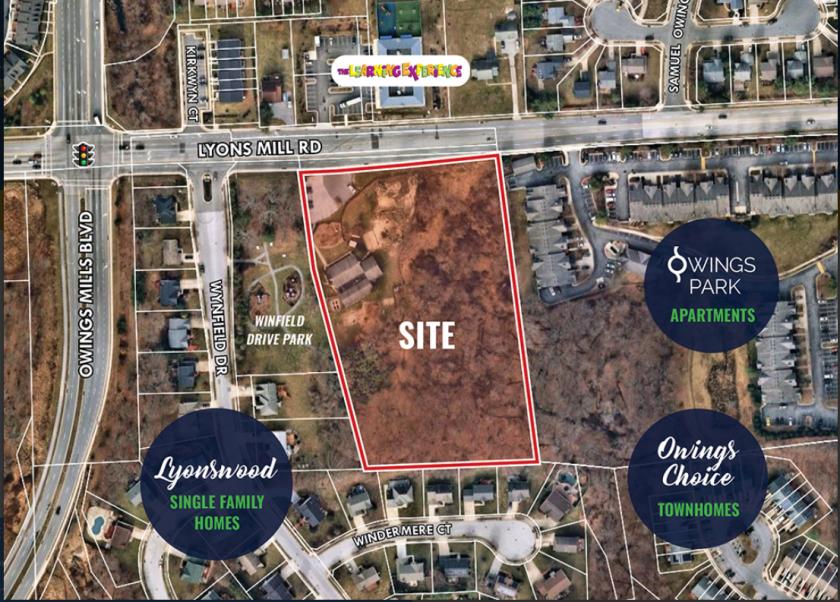
1-Mile | 3-Miles | 5-Miles | ||
---|---|---|---|---|
Total Population | 15,748 | 89,581 | 175,885 | |
Population Median Age | 38 | 38 | 40 | |
Population by Age | 0-9 Yrs | 2183 (13%) | 10424 (11%) | 19711 (11%) |
10-19 Yrs | 1627 (10%) | 11819 (13%) | 22730 (12%) | |
20-29 Yrs | 1995 (12%) | 12188 (13%) | 22444 (12%) | |
30-39 Yrs | 2665 (16%) | 13867 (15%) | 24990 (14%) | |
40-49 Yrs | 2045 (12%) | 11473 (12%) | 22487 (12%) | |
50-59 Yrs | 2135 (13%) | 11533 (12%) | 23692 (13%) | |
60-69 Yrs | 1729 (10%) | 10197 (11%) | 20699 (11%) | |
70+ Yrs | 1368 (8%) | 8079 (9%) | 19132 (10%) | |
Median HH Income | $92,373 | $81,444 | $78,991 | |
Total Household Income | < 24K | 388 (6%) | 3830 (11%) | 8696 (12%) |
25-49K | 877 (13%) | 5716 (16%) | 11397 (16%) | |
50-74K | 1121 (17%) | 5821 (17%) | 11780 (17%) | |
75-99K | 1165 (18%) | 5670 (16%) | 10481 (15%) | |
100-199K | 2454 (38%) | 10604 (31%) | 19730 (29%) | |
200K+ | 387 (6%) | 2016 (5%) | 5009 (7%) | |
Highest Education Level | No Diploma | 442 | 4246 | 9242 |
Diploma or GED | 1643 | 13660 | 27935 | |
Some College | 2008 | 12995 | 25464 | |
Assoc. Degree | 800 | 4609 | 8834 | |
Bachelors Degree | 3338 | 15560 | 30573 | |
Higher Degree | 2683 | 10215 | 20699 | |
Total Housing Units | 6,845 | 35,897 | 71,456 | |
--Owner-Occupied | 3,411 | 19,238 | 40,320 | |
--Renter-Occupied | 2,981 | 14,419 | 26,773 | |
Owner-Occupied Values | < 100K | 44 | 470 | 1948 |
100-199K | 732 | 4640 | 9772 | |
200-299K | 1494 | 8547 | 15773 | |
300-399K | 732 | 3172 | 6001 | |
400-499K | 395 | 1406 | 3194 | |
500K+ | 14 | 1003 | 3632 | |
Total Working Age Population | 12,430 | 71,971 | 142,358 | |
In Work Force | 9,353 | 50,348 | 96,897 | |
Not In Work Force | 3,076 | 21,623 | 45,461 | |
Workforce Employed | 8,856 | 47,566 | 91,745 | |
Workforce Unemployed | 481 | 2,680 | 5,024 | |
Civlian Workforce | 9,337 | 50,246 | 96,769 | |
Military Workforce | 17 | 102 | 129 | |
Total Households | 6,392 | 33,657 | 67,093 | |
Family Households | 3,674 | 21,063 | 42,999 | |
Non-Family Households | 2,718 | 12,594 | 24,093 | |
Married Couple | 2,574 | 13,436 | 27,329 | |
Other Family | 1,101 | 7,627 | 15,671 | |
Married w/Child | 1,141 | 5,583 | 10,348 | |
Single Male w/Child | 62 | 713 | 1,490 | |
Single Female w/Child | 402 | 2,671 | 5,863 |
Population Change Last Two Decades - Plus Projection
2000 | % | 2010 | % | 2020 | % | 2030 | |
---|---|---|---|---|---|---|---|
Maryland | 5,296,486 | +9 | 5,773,552 | +6 | 6,141,900 | +6 | 6,518,750 |
Baltimore County | 754,292 | +7 | 805,029 | +5 | 847,000 | +2 | 862,200 |
Carroll County | 150,897 | +11 | 167,134 | +1 | 169,200 | +4 | 175,150 |
Howard County | 247,842 | +16 | 287,085 | +17 | 336,900 | +9 | 366,800 |
Baltimore city | 651,154 | -5 | 620,961 | -1 | 616,300 | +1 | 625,100 |
Total Working Age Population:
Total Households:
Total Working Age Population:
Total Households:
Total Working Age Population:
Total Households: