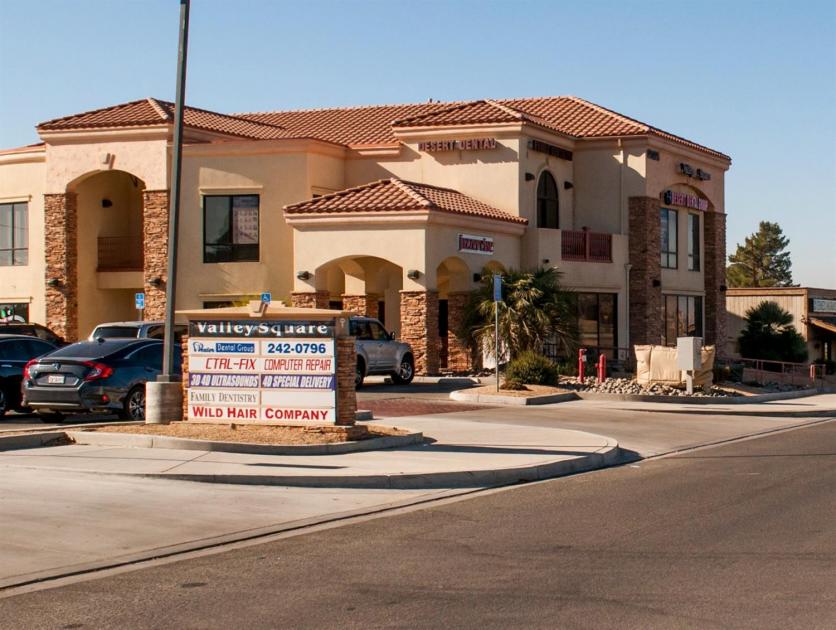
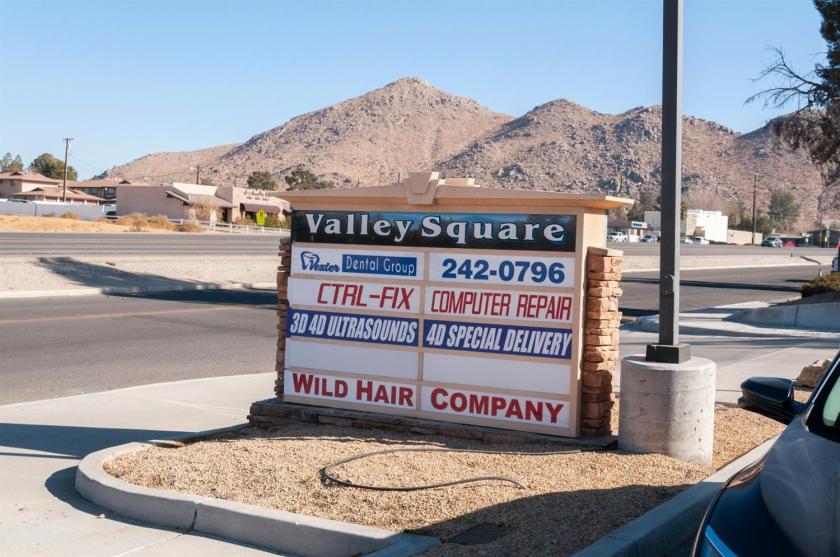
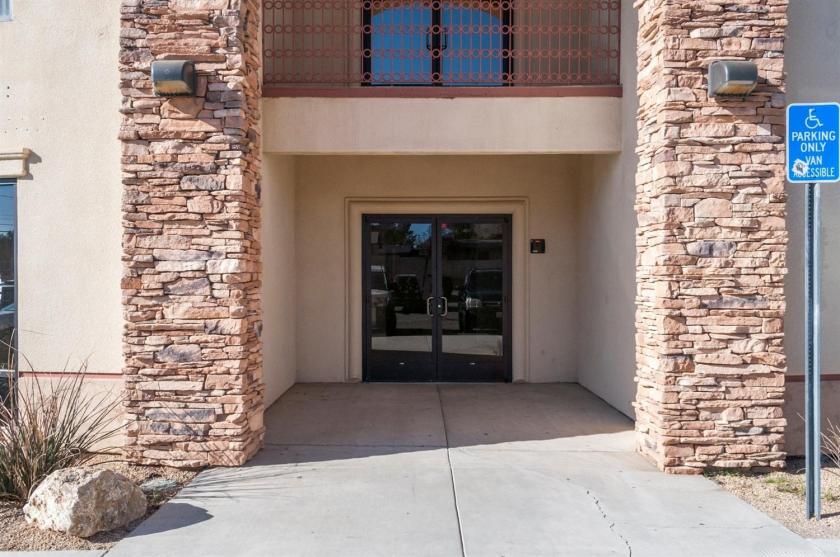
1-Mile | 3-Miles | 5-Miles | ||
---|---|---|---|---|
Total Population | 4,952 | 33,754 | 97,835 | |
Population Median Age | 36 | 36 | 36 | |
Population by Age | 0-9 Yrs | 950 (19%) | 5688 (16%) | 16062 (16%) |
10-19 Yrs | 691 (13%) | 4878 (14%) | 15473 (15%) | |
20-29 Yrs | 582 (11%) | 4707 (13%) | 13176 (13%) | |
30-39 Yrs | 655 (13%) | 3977 (11%) | 11244 (11%) | |
40-49 Yrs | 489 (9%) | 3231 (9%) | 10368 (10%) | |
50-59 Yrs | 463 (9%) | 4000 (11%) | 12190 (12%) | |
60-69 Yrs | 507 (10%) | 3810 (11%) | 9947 (10%) | |
70+ Yrs | 615 (12%) | 3462 (10%) | 9374 (9%) | |
Median HH Income | $54,670 | $58,621 | $54,277 | |
Total Household Income | < 24K | 136 (8%) | 1866 (17%) | 6356 (20%) |
25-49K | 621 (38%) | 2717 (25%) | 7775 (25%) | |
50-74K | 252 (15%) | 1480 (14%) | 4882 (16%) | |
75-99K | 171 (10%) | 1318 (12%) | 3816 (12%) | |
100-199K | 335 (20%) | 2490 (23%) | 6210 (20%) | |
200K+ | 93 (5%) | 616 (5%) | 1315 (4%) | |
Highest Education Level | No Diploma | 479 | 2942 | 9956 |
Diploma or GED | 847 | 6085 | 17845 | |
Some College | 697 | 5385 | 15854 | |
Assoc. Degree | 352 | 2388 | 5934 | |
Bachelors Degree | 432 | 2439 | 6377 | |
Higher Degree | 219 | 1695 | 4043 | |
Total Housing Units | 1,720 | 11,607 | 33,260 | |
--Owner-Occupied | 1,077 | 6,675 | 18,310 | |
--Renter-Occupied | 532 | 3,812 | 12,045 | |
Owner-Occupied Values | < 100K | 133 | 422 | 1226 |
100-199K | 125 | 935 | 3996 | |
200-299K | 538 | 2627 | 7385 | |
300-399K | 208 | 1417 | 3198 | |
400-499K | 34 | 639 | 1289 | |
500K+ | 39 | 635 | 1215 | |
Total Working Age Population | 3,622 | 25,540 | 72,727 | |
In Work Force | 2,041 | 13,808 | 39,205 | |
Not In Work Force | 1,580 | 11,732 | 33,522 | |
Workforce Employed | 1,810 | 12,132 | 34,157 | |
Workforce Unemployed | 231 | 1,676 | 5,011 | |
Civlian Workforce | 2,041 | 13,808 | 39,167 | |
Military Workforce | 0 | 0 | 38 | |
Total Households | 1,609 | 10,487 | 30,355 | |
Family Households | 1,232 | 8,257 | 23,368 | |
Non-Family Households | 376 | 2,231 | 6,986 | |
Married Couple | 806 | 5,751 | 15,593 | |
Other Family | 427 | 2,506 | 7,775 | |
Married w/Child | 196 | 2,049 | 6,465 | |
Single Male w/Child | 218 | 623 | 1,268 | |
Single Female w/Child | 100 | 798 | 2,732 |
Population Change Last Two Decades - Plus Projection
2000 | % | 2010 | % | 2020 | % | 2030 | |
---|---|---|---|---|---|---|---|
California | 33,871,648 | +10 | 37,253,956 | +9 | 40,467,295 | +8 | 43,631,295 |
San Bernardino County | 1,709,434 | +19 | 2,035,210 | +9 | 2,223,189 | +11 | 2,468,202 |
Total Working Age Population:
Total Households:
Total Working Age Population:
Total Households:
Total Working Age Population:
Total Households: