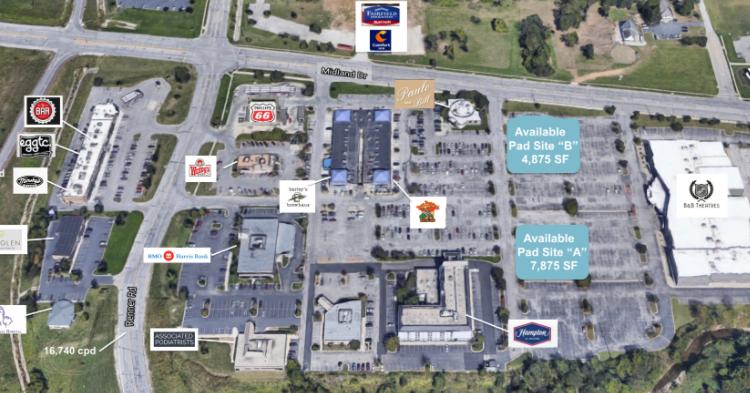
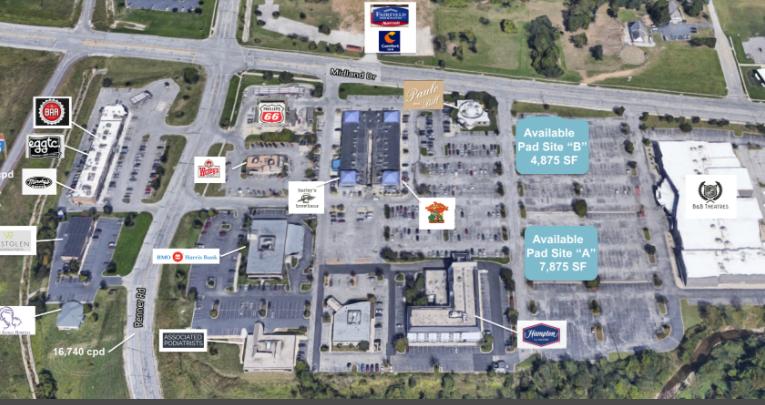
Retail pad sites located in Westglen Shopping Center which anchors an established Retail Corridor in affluent Western Shawnee. Surrounding high income residential developments drive retail demand. The center includes abundant parking due to expansive cross-easements in place. Ultra convenient regional access is due to the center's adjacency to I-435.
Highlights
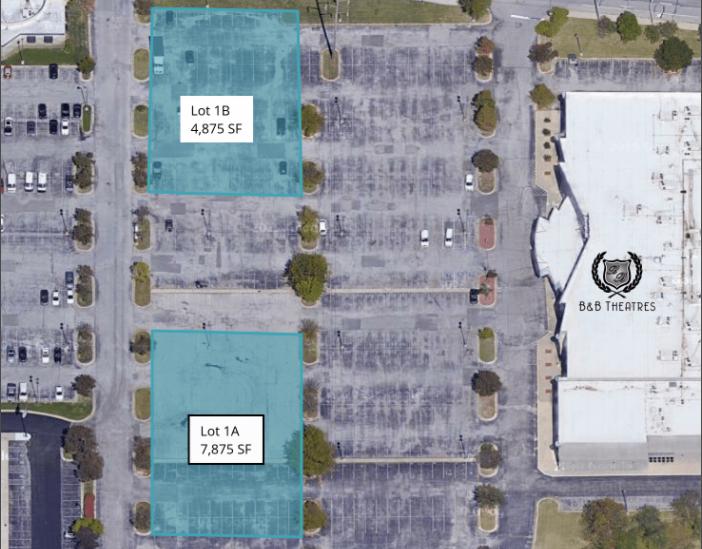
2 Retail pad sites available
Pad "A" - 7,875 Buildable Square Feet
Pad "B" - 4,875 Buildable Square Feet
Perfect for drive-thru Restaurant or Retail/Office building
Join B&B Theatres, Barley's Kitchen, Jose Peppers, Paulo and Bill, Wendy's, and many others
No part of this information may be copied, reproduced, repurposed, or screen-captured for any commercial purpose without prior written authorization from MyEListing.
While we strive to provide the most accurate information, all listing information, and demographic data, is provided by third-parties. As such, MyEListing will not be responsible for the accuracy of the information. It is strongly recommended that you verify all information with the listing agent, and any relevant agencies, prior to making any decisions.
What is the asking price for 16301 Midland Drive in Shawnee?
The asking price for 16301 Midland Drive is $690,000
How much land does the Shawnee, KS property at 16301 Midland Drive include?
16301 Midland Drive in Shawnee includes 0.293 acres of land
What kind of Land is the propery at 16301 Midland Drive?
The property at 16301 Midland Drive Shawnee, KS 66217 is listed as a Retail Pad Site Land property
What is the population within 1 mile of 16301 Midland Drive in Shawnee?
The population within 1 mile of 16301 Midland Drive Shawnee, KS 66217 is 3,696 people.
Who do I contact for questions about 16301 Midland Drive?
You should contact the listing agent,
Kim Ansari, for any details regarding this commercial listing.