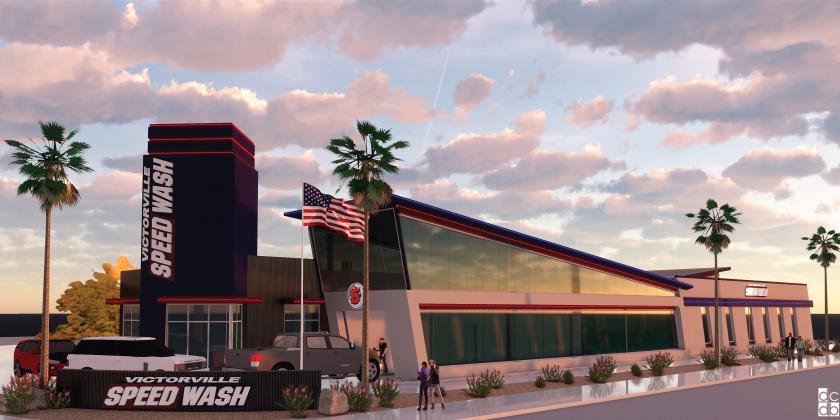
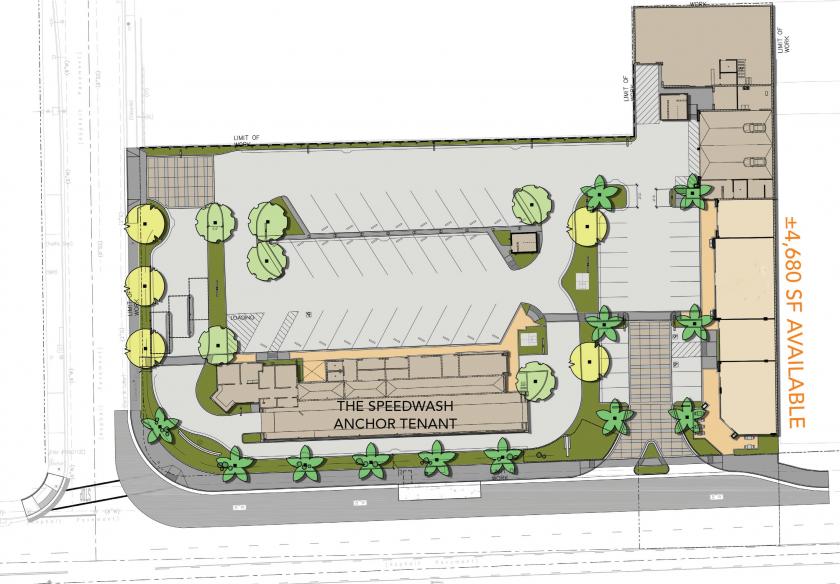
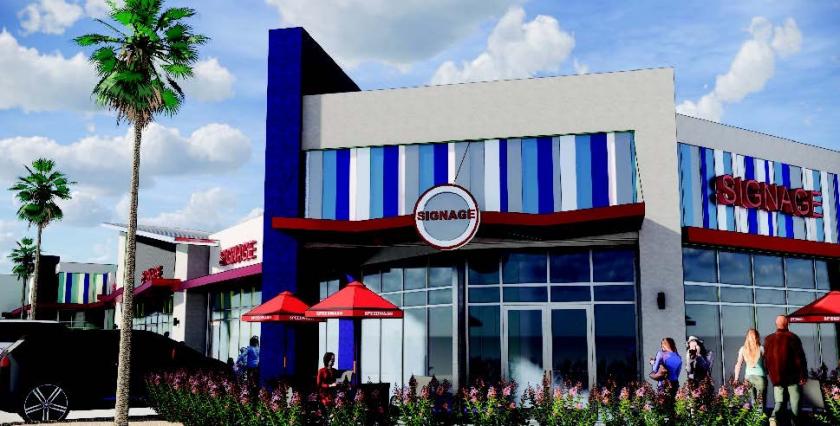
1-Mile | 3-Miles | 5-Miles | ||
---|---|---|---|---|
Total Population | 11,741 | 83,723 | 161,054 | |
Population Median Age | 29 | 32 | 33 | |
Population by Age | 0-9 Yrs | 2666 (22%) | 15609 (18%) | 27722 (17%) |
10-19 Yrs | 2336 (19%) | 14910 (17%) | 28001 (17%) | |
20-29 Yrs | 1618 (13%) | 12350 (14%) | 23335 (14%) | |
30-39 Yrs | 1592 (13%) | 10602 (12%) | 20660 (12%) | |
40-49 Yrs | 1112 (9%) | 9122 (10%) | 18472 (11%) | |
50-59 Yrs | 1019 (8%) | 9353 (11%) | 18955 (11%) | |
60-69 Yrs | 671 (5%) | 6056 (7%) | 12925 (8%) | |
70+ Yrs | 729 (6%) | 5720 (6%) | 10984 (6%) | |
Median HH Income | $36,988 | $48,414 | $56,469 | |
Total Household Income | < 24K | 1031 (30%) | 5834 (25%) | 9129 (20%) |
25-49K | 1129 (33%) | 6092 (26%) | 11143 (24%) | |
50-74K | 629 (18%) | 4551 (19%) | 8261 (18%) | |
75-99K | 225 (6%) | 2635 (11%) | 6107 (13%) | |
100-199K | 342 (10%) | 3730 (15%) | 8992 (20%) | |
200K+ | 43 (1%) | 492 (2%) | 1171 (2%) | |
Highest Education Level | No Diploma | 1414 | 10859 | 20179 |
Diploma or GED | 2137 | 14094 | 28208 | |
Some College | 1530 | 12976 | 25451 | |
Assoc. Degree | 505 | 3900 | 7754 | |
Bachelors Degree | 448 | 3949 | 8157 | |
Higher Degree | 100 | 1866 | 4774 | |
Total Housing Units | 3,715 | 24,820 | 48,135 | |
--Owner-Occupied | 1,008 | 11,751 | 25,836 | |
--Renter-Occupied | 2,391 | 11,585 | 18,968 | |
Owner-Occupied Values | < 100K | 332 | 1238 | 1698 |
100-199K | 307 | 3684 | 6623 | |
200-299K | 301 | 5482 | 12752 | |
300-399K | 48 | 1056 | 3119 | |
400-499K | 14 | 94 | 692 | |
500K+ | 7 | 197 | 952 | |
Total Working Age Population | 7,626 | 58,635 | 116,620 | |
In Work Force | 4,340 | 32,995 | 65,021 | |
Not In Work Force | 3,287 | 25,640 | 51,599 | |
Workforce Employed | 3,433 | 28,071 | 56,828 | |
Workforce Unemployed | 895 | 4,811 | 8,018 | |
Civlian Workforce | 4,328 | 32,882 | 64,846 | |
Military Workforce | 11 | 113 | 176 | |
Total Households | 3,400 | 23,335 | 44,804 | |
Family Households | 2,499 | 17,739 | 35,008 | |
Non-Family Households | 901 | 5,596 | 9,796 | |
Married Couple | 1,170 | 10,434 | 22,258 | |
Other Family | 1,328 | 7,305 | 12,750 | |
Married w/Child | 751 | 5,575 | 10,988 | |
Single Male w/Child | 262 | 1,127 | 2,060 | |
Single Female w/Child | 570 | 2,773 | 4,494 |
Population Change Last Two Decades - Plus Projection
2000 | % | 2010 | % | 2020 | % | 2030 | |
---|---|---|---|---|---|---|---|
California | 33,871,648 | +10 | 37,253,956 | +9 | 40,467,295 | +8 | 43,631,295 |
San Bernardino County | 1,709,434 | +19 | 2,035,210 | +9 | 2,223,189 | +11 | 2,468,202 |
Total Working Age Population:
Total Households:
Total Working Age Population:
Total Households:
Total Working Age Population:
Total Households: