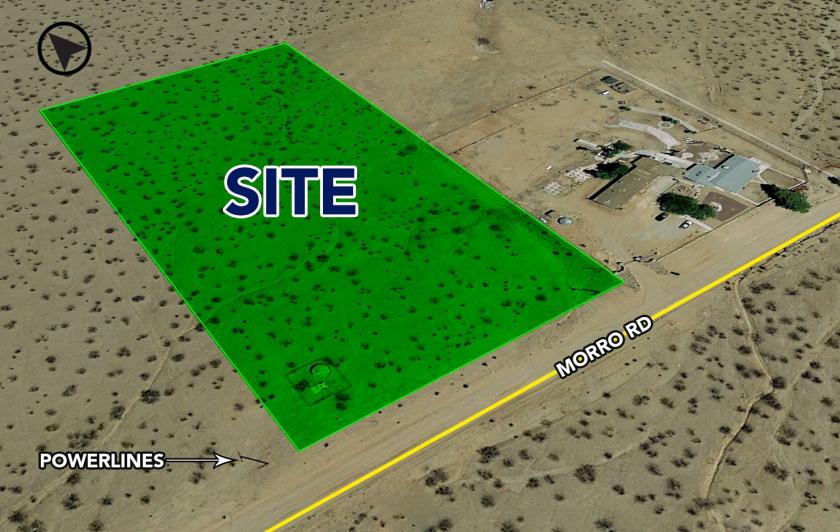
Visible from I-15 - Just East of Dale Evans & I-15 Interchange - Average Daily Traffic is 55,000
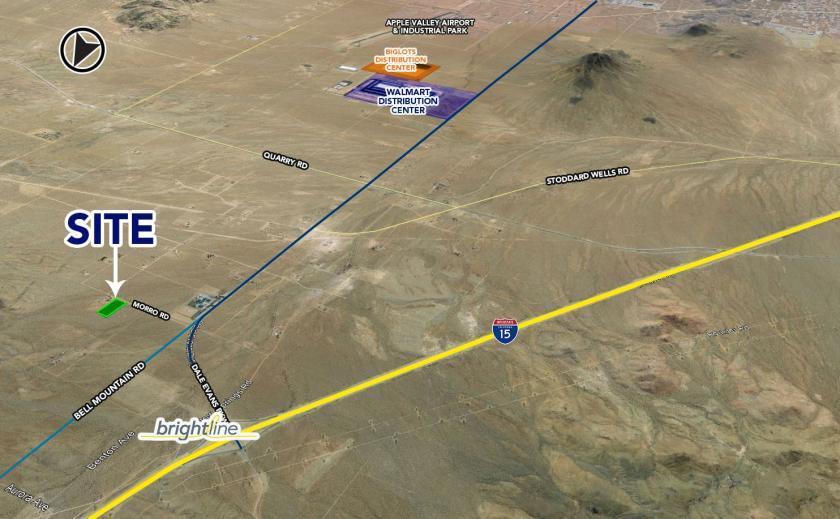
Property is east of the Planned Southern California Station for the High-Speed Train to Las Vegas
Property is North of Apple Valley Industrial Park & 1,250,000 SF Wal-Mart Distribution Center
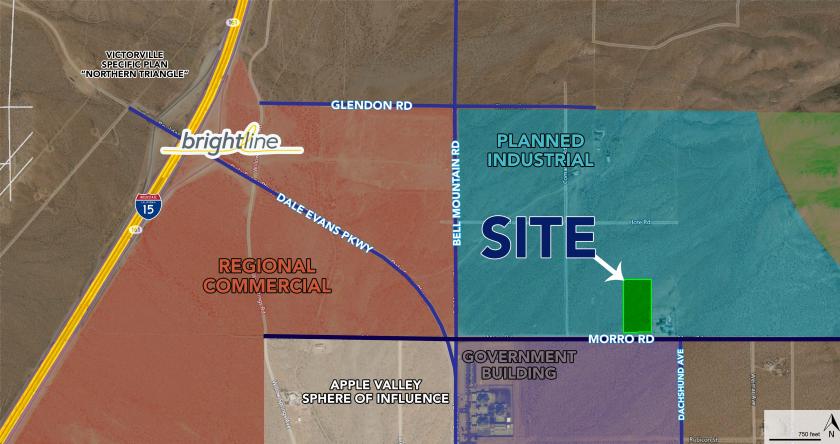
Property is East of the I-15 Intersection Zoned for Regional Commercial
AREA DESCRIPTION: North Apple Valley location Just East of Dale Evans Parkway and East of Interstate 15 Interchange is zoned for Regional Commercial, West exit is the Victorville Specific Plan in the path of future growth.
The ±4.85 Acre site is located near the I-15 Freeway in the unincorporated area of San Bernardino County approximately ½ miles north of the Town of Apple Valley’s city limits.
The property is currently located in the planned Industrial Zone. (Buyer to Confirm)
The property is in the Sphere of Influence of the Town of Apple Valley. Any land-use change would have to be approved by the Town as well as the County. Solar is also a possibility. (Buyer to Verify)
The site is north of the 5,500 Acre Apple Valley Industrial Park and the 1,250,000 SF Walmart Distribution Center and the 1,300,000 SF Big Lots Distribution Center.
No part of this information may be copied, reproduced, repurposed, or screen-captured for any commercial purpose without prior written authorization from MyEListing.
While we strive to provide the most accurate information, all listing information, and demographic data, is provided by third-parties. As such, MyEListing will not be responsible for the accuracy of the information. It is strongly recommended that you verify all information with the listing agent, and any relevant agencies, prior to making any decisions.
What is the asking price for 21101 Dale Evans Pkwy in Apple Valley?
The asking price for 21101 Dale Evans Pkwy is $318,250
How much land does the Apple Valley, CA property at 21101 Dale Evans Pkwy include?
21101 Dale Evans Pkwy in Apple Valley includes 4.850 acres of land
What kind of Land is the propery at 21101 Dale Evans Pkwy?
The property at 21101 Dale Evans Pkwy Apple Valley, CA 92307 is listed as a Agricultural Land Land property
What is the population within 1 mile of 21101 Dale Evans Pkwy in Apple Valley?
The population within 1 mile of 21101 Dale Evans Pkwy Apple Valley, CA 92307 is 399 people.
Who do I contact for questions about 21101 Dale Evans Pkwy?
You should contact the listing agent,
Renee Beck, for any details regarding this commercial listing.