Industrial Properties
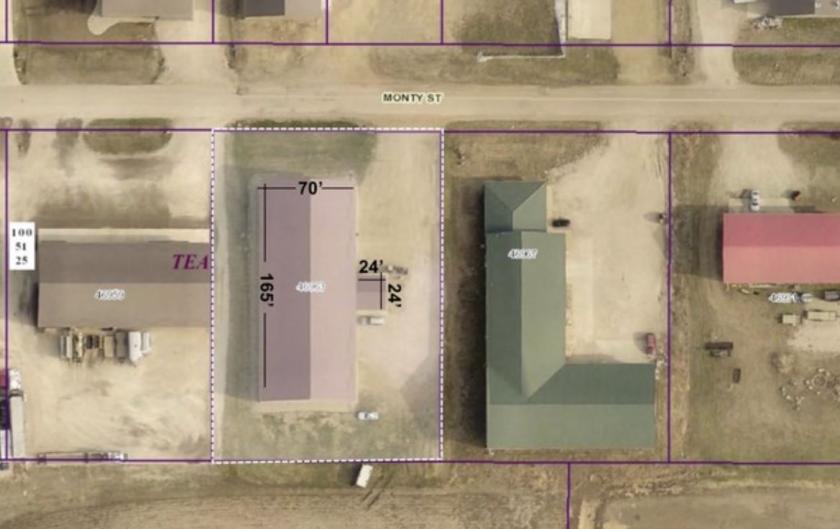
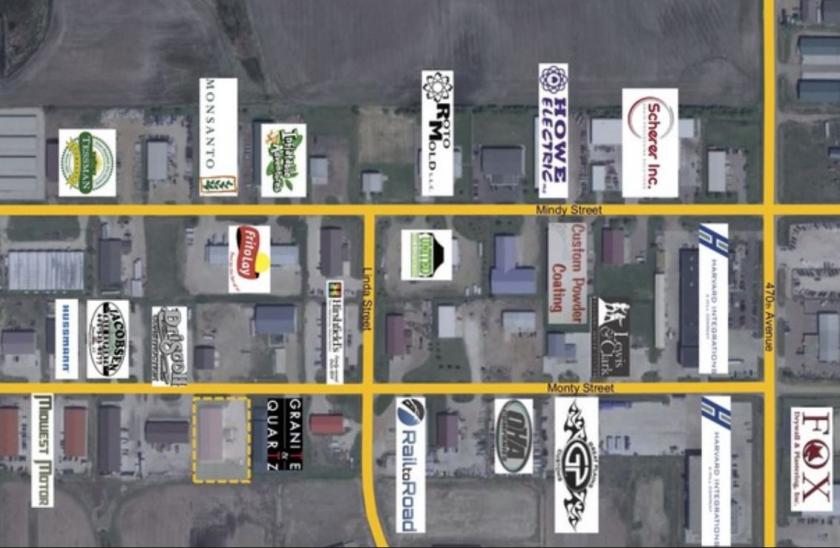
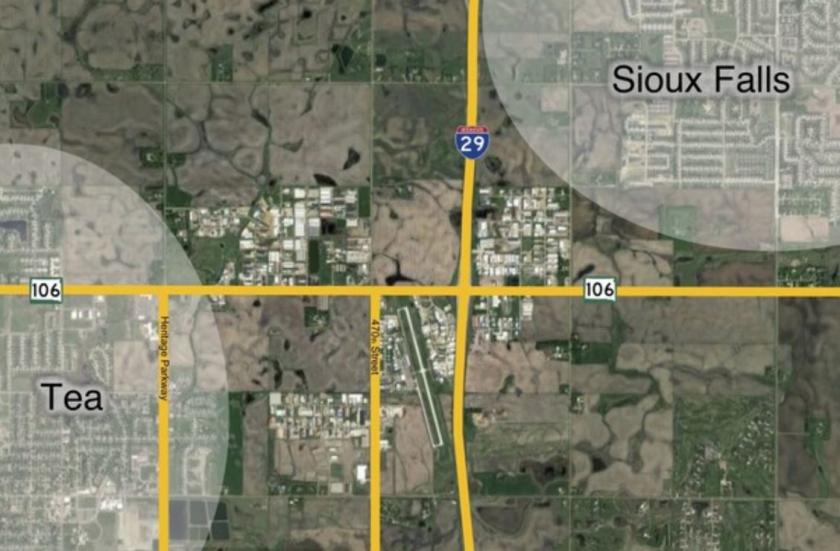
46963 Monty Street Tea, SD 57064
46963 Monty Street Tea, SD 57064

Details & Description
Additional Photos
Listing Agents

Ryan Tysdal
O: 605-376-0127
ryan@vbclink.com
O: 605-376-0127
ryan@vbclink.com
While we strive to provide the most accurate information, all listing information, and demographic data, is provided by third-parties. As such, MyEListing will not be responsible for the accuracy of the information. It is strongly recommended that you verify all information with the listing agent, and any relevant agencies, prior to making any decisions.


