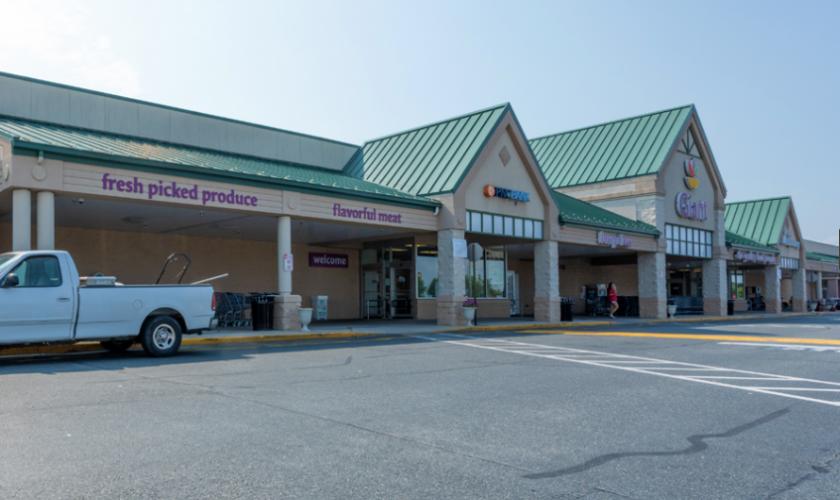
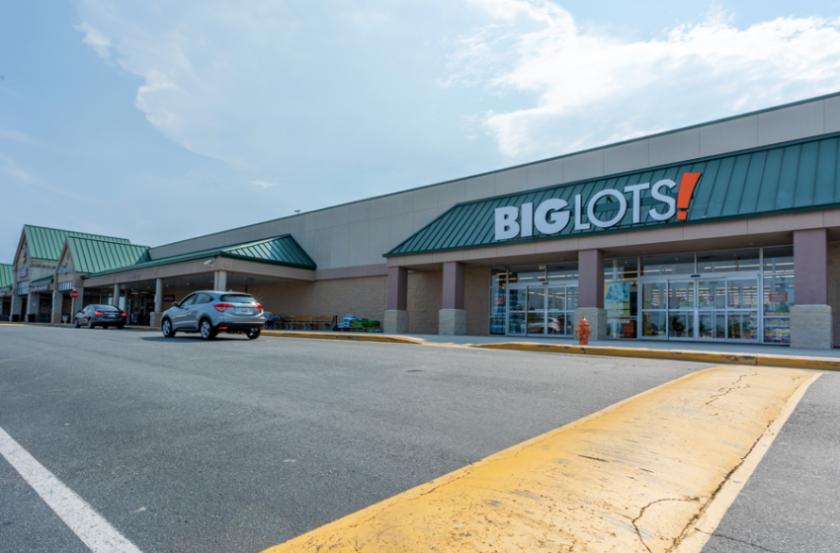
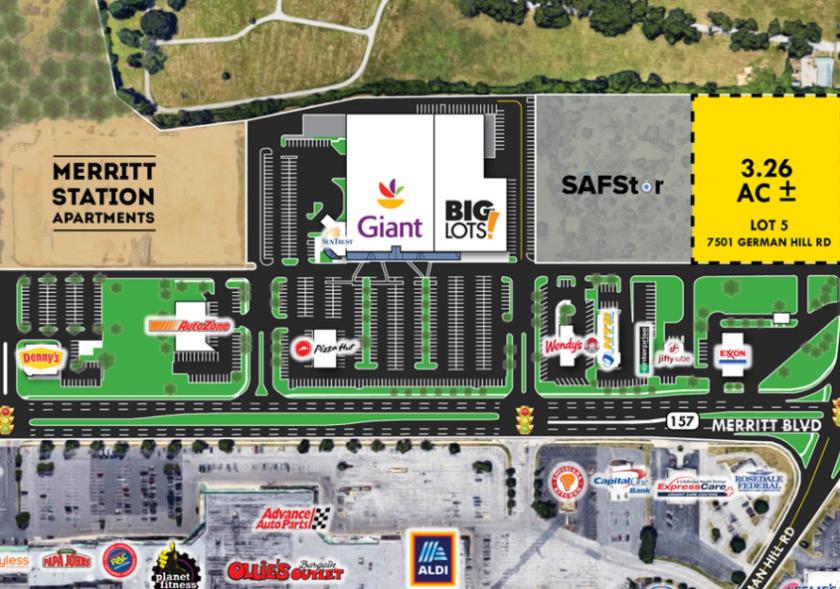
1-Mile | 3-Miles | 5-Miles | ||
---|---|---|---|---|
Total Population | 15,163 | 99,708 | 302,178 | |
Population Median Age | 39 | 39 | 38 | |
Population by Age | 0-9 Yrs | 2043 (13%) | 13702 (13%) | 39941 (13%) |
10-19 Yrs | 1694 (11%) | 12017 (12%) | 33306 (11%) | |
20-29 Yrs | 1940 (12%) | 13301 (13%) | 46655 (15%) | |
30-39 Yrs | 2146 (14%) | 13546 (13%) | 48376 (16%) | |
40-49 Yrs | 1674 (11%) | 11267 (11%) | 34689 (11%) | |
50-59 Yrs | 2064 (13%) | 13466 (13%) | 39123 (12%) | |
60-69 Yrs | 1947 (12%) | 12126 (12%) | 33657 (11%) | |
70+ Yrs | 1656 (10%) | 10283 (10%) | 26431 (8%) | |
Median HH Income | $57,620 | $55,503 | $59,843 | |
Total Household Income | < 24K | 1078 (20%) | 7665 (21%) | 23320 (20%) |
25-49K | 1107 (20%) | 8473 (23%) | 25278 (21%) | |
50-74K | 1296 (24%) | 7343 (20%) | 20874 (18%) | |
75-99K | 758 (14%) | 4740 (13%) | 13999 (12%) | |
100-199K | 1022 (19%) | 7050 (19%) | 24616 (21%) | |
200K+ | 115 (2%) | 915 (2%) | 7691 (6%) | |
Highest Education Level | No Diploma | 1637 | 12860 | 31661 |
Diploma or GED | 4705 | 27253 | 70877 | |
Some College | 2251 | 13746 | 40392 | |
Assoc. Degree | 668 | 4338 | 11797 | |
Bachelors Degree | 909 | 6328 | 31659 | |
Higher Degree | 430 | 3672 | 24809 | |
Total Housing Units | 5,964 | 40,437 | 133,505 | |
--Owner-Occupied | 3,744 | 22,737 | 65,595 | |
--Renter-Occupied | 1,632 | 13,449 | 50,183 | |
Owner-Occupied Values | < 100K | 474 | 4175 | 11066 |
100-199K | 2362 | 12232 | 26682 | |
200-299K | 706 | 4008 | 14778 | |
300-399K | 138 | 1796 | 6806 | |
400-499K | 35 | 294 | 2760 | |
500K+ | 28 | 232 | 3503 | |
Total Working Age Population | 12,108 | 78,768 | 241,569 | |
In Work Force | 7,147 | 48,924 | 160,264 | |
Not In Work Force | 4,961 | 29,844 | 81,305 | |
Workforce Employed | 6,752 | 45,598 | 149,720 | |
Workforce Unemployed | 395 | 3,288 | 10,145 | |
Civlian Workforce | 7,147 | 48,886 | 159,865 | |
Military Workforce | 0 | 38 | 399 | |
Total Households | 5,375 | 36,186 | 115,779 | |
Family Households | 3,537 | 22,695 | 66,394 | |
Non-Family Households | 1,839 | 13,491 | 49,385 | |
Married Couple | 2,317 | 14,098 | 38,217 | |
Other Family | 1,219 | 8,597 | 28,177 | |
Married w/Child | 836 | 5,148 | 13,350 | |
Single Male w/Child | 129 | 1,128 | 3,104 | |
Single Female w/Child | 535 | 2,904 | 10,171 |
Population Change Last Two Decades - Plus Projection
2000 | % | 2010 | % | 2020 | % | 2030 | |
---|---|---|---|---|---|---|---|
Maryland | 5,296,486 | +9 | 5,773,552 | +6 | 6,141,900 | +6 | 6,518,750 |
Anne Arundel County | 489,656 | +10 | 537,656 | +7 | 573,250 | +4 | 596,700 |
Baltimore County | 754,292 | +7 | 805,029 | +5 | 847,000 | +2 | 862,200 |
Harford County | 218,590 | +12 | 244,826 | +5 | 257,700 | +5 | 271,850 |
Queen Annes County | 40,563 | +18 | 47,798 | +6 | 50,750 | +10 | 55,750 |
Baltimore city | 651,154 | -5 | 620,961 | -1 | 616,300 | +1 | 625,100 |
Total Working Age Population:
Total Households:
Total Working Age Population:
Total Households:
Total Working Age Population:
Total Households: