Highlights:
Private REO - Seller took Possession of the Property on April 9, 2020!
Out-of-State Ownership - Opportunity for Hands-On Ownership!
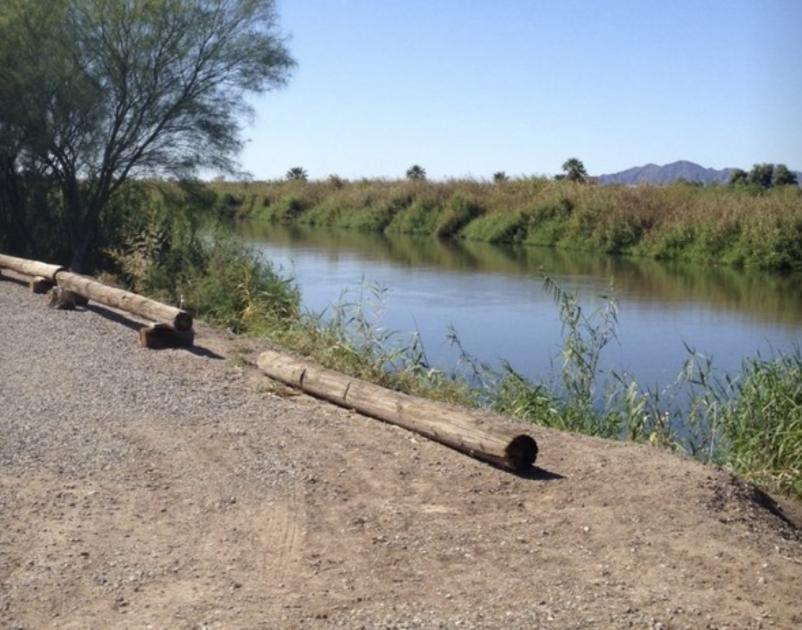
Colorado River Frontage!
Easy Access to and from Highway 8 for Visitors,and near Dining, Shopping and Commercial Development!
$14,487 Per Space!
Potential 12.4 CAP Rate as Family Park Conversion
Current 5.6 CAP RATE
Current Senior 55 Plus Park!
Potential Conversion to Family Park!
Description:
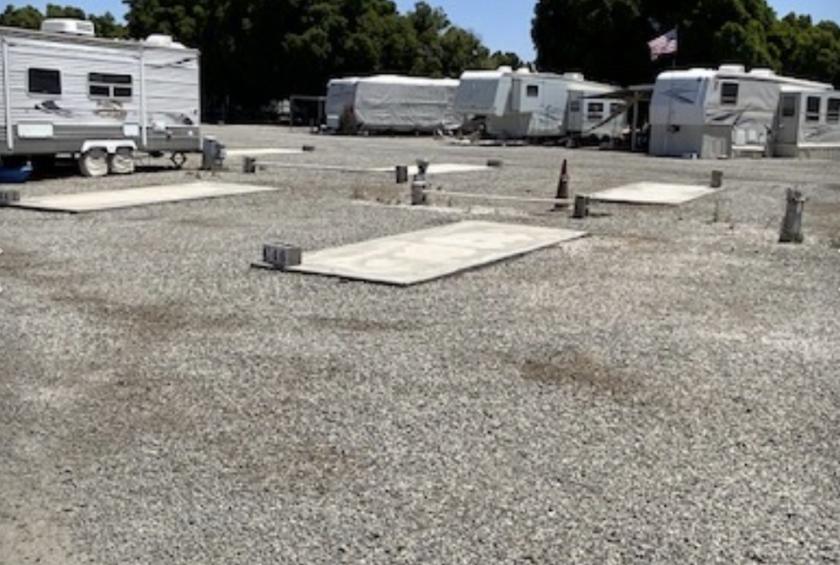
Recently taken over by the Out-of-State Seller, the property is an opportunity to purchase a well-located property with Colorado River frontage. The property offers the potential upside of the Colorado River (boating, fishing) and offers its existing tenants and visitors an attractive Clubhouse with Kitchen and Restrooms, Park Office, and exterior Game/Gathering Areas. The long-term On-Site manager has proven to be a significant help to the Out-of-State Owner. Included has been the Managers providing necessary management input, monthly Financial Income Reports, and taking care of minor Maintenance at the Property.
The Buyer should be aware that the tenancy is comprised of both Permanent and Seasonal tenants.
Location:
Situated just off of the Arizona,/California border, Hidden Cove RV and Mobile Home Park is located off of Water Street and situated on a 5.19 Acre Lot that directly borders the Colorado River to the North. The Property is located just to the South of the Colorado River. The Location has quick and easy access to HWY 8 with exit off of the 4th Street Offramp. The close proximity to the HWY provided easy access to shopping, dining and commercial development The property location is north of the intersection of 1st Street and 24th Street. The Property rests near a mature residential neighborhood of single-family homes and two public parks (Latino American Park and Joe Henry Park).
No part of this information may be copied, reproduced, repurposed, or screen-captured for any commercial purpose without prior written authorization from MyEListing.
While we strive to provide the most accurate information, all listing information, and demographic data, is provided by third-parties. As such, MyEListing will not be responsible for the accuracy of the information. It is strongly recommended that you verify all information with the listing agent, and any relevant agencies, prior to making any decisions.
What is the asking price for 2450 West Water Street in Yuma?
The asking price for 2450 West Water Street is $1,595,000
How much land does the Yuma, AZ property at 2450 West Water Street include?
2450 West Water Street in Yuma includes 5.190 acres of land
What kind of Land is the propery at 2450 West Water Street?
The property at 2450 West Water Street Yuma, AZ 85364 is listed as a Single Family Land Land property
What is the population within 1 mile of 2450 West Water Street in Yuma?
The population within 1 mile of 2450 West Water Street Yuma, AZ 85364 is 7,062 people.
Who do I contact for questions about 2450 West Water Street?
You should contact the listing agent,
Luis Vazquez, for any details regarding this commercial listing.