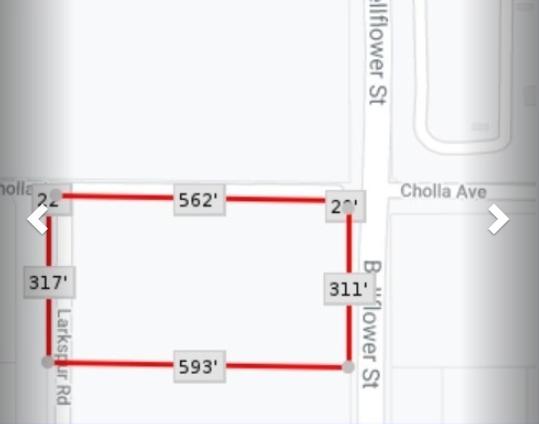
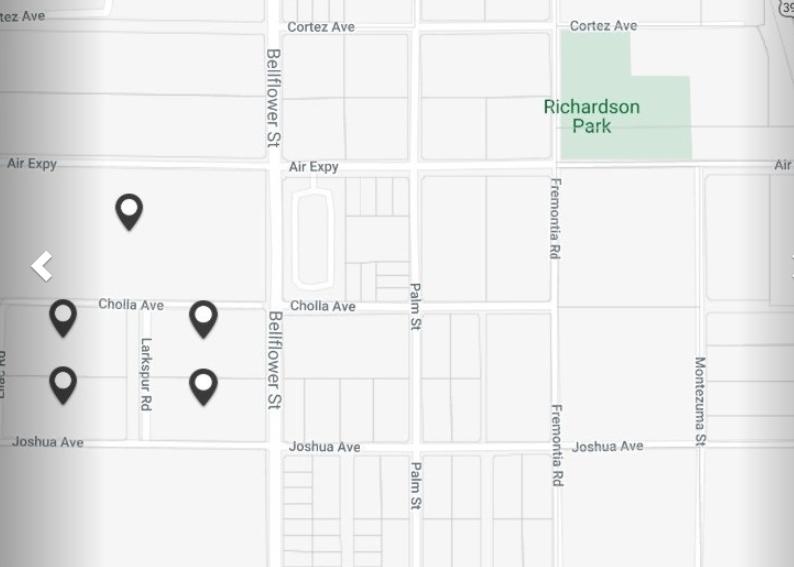
1-Mile | 3-Miles | 5-Miles | ||
---|---|---|---|---|
Total Population | 1,829 | 17,321 | 49,825 | |
Population Median Age | 30 | 31 | 31 | |
Population by Age | 0-9 Yrs | 290 (15%) | 3004 (17%) | 9005 (18%) |
10-19 Yrs | 366 (20%) | 3300 (19%) | 8745 (17%) | |
20-29 Yrs | 349 (19%) | 2445 (14%) | 6878 (13%) | |
30-39 Yrs | 217 (11%) | 2758 (15%) | 8184 (16%) | |
40-49 Yrs | 292 (15%) | 2405 (13%) | 6775 (13%) | |
50-59 Yrs | 130 (7%) | 1743 (10%) | 5308 (10%) | |
60-69 Yrs | 129 (7%) | 1078 (6%) | 3365 (6%) | |
70+ Yrs | 56 (3%) | 589 (3%) | 1566 (3%) | |
Median HH Income | $34,931 | $41,133 | $53,207 | |
Total Household Income | < 24K | 170 (35%) | 1227 (30%) | 2430 (21%) |
25-49K | 121 (25%) | 1145 (28%) | 3080 (26%) | |
50-74K | 97 (20%) | 642 (16%) | 2146 (18%) | |
75-99K | 57 (11%) | 460 (11%) | 1585 (13%) | |
100-199K | 7 (1%) | 376 (9%) | 1924 (16%) | |
200K+ | 27 (5%) | 148 (3%) | 259 (2%) | |
Highest Education Level | No Diploma | 392 | 3384 | 8242 |
Diploma or GED | 220 | 2888 | 8707 | |
Some College | 283 | 2433 | 7578 | |
Assoc. Degree | 40 | 573 | 1829 | |
Bachelors Degree | 44 | 459 | 1539 | |
Higher Degree | 3 | 195 | 992 | |
Total Housing Units | 562 | 4,438 | 12,311 | |
--Owner-Occupied | 174 | 1,874 | 6,811 | |
--Renter-Occupied | 305 | 2,123 | 4,613 | |
Owner-Occupied Values | < 100K | 95 | 459 | 641 |
100-199K | 43 | 730 | 1974 | |
200-299K | 31 | 589 | 3492 | |
300-399K | 4 | 71 | 567 | |
400-499K | 0 | 20 | 26 | |
500K+ | 0 | 5 | 112 | |
Total Working Age Population | 1,308 | 12,208 | 35,340 | |
In Work Force | 734 | 5,672 | 17,892 | |
Not In Work Force | 573 | 6,536 | 17,448 | |
Workforce Employed | 631 | 4,808 | 15,487 | |
Workforce Unemployed | 104 | 853 | 2,364 | |
Civlian Workforce | 734 | 5,661 | 17,851 | |
Military Workforce | 0 | 11 | 40 | |
Total Households | 478 | 3,997 | 11,424 | |
Family Households | 406 | 3,311 | 9,468 | |
Non-Family Households | 72 | 686 | 1,956 | |
Married Couple | 203 | 1,737 | 5,740 | |
Other Family | 203 | 1,575 | 3,727 | |
Married w/Child | 116 | 1,045 | 3,153 | |
Single Male w/Child | 17 | 297 | 622 | |
Single Female w/Child | 135 | 839 | 1,601 |
Population Change Last Two Decades - Plus Projection
2000 | % | 2010 | % | 2020 | % | 2030 | |
---|---|---|---|---|---|---|---|
California | 33,871,648 | +10 | 37,253,956 | +9 | 40,467,295 | +8 | 43,631,295 |
San Bernardino County | 1,709,434 | +19 | 2,035,210 | +9 | 2,223,189 | +11 | 2,468,202 |
Total Working Age Population:
Total Households:
Total Working Age Population:
Total Households:
Total Working Age Population:
Total Households: