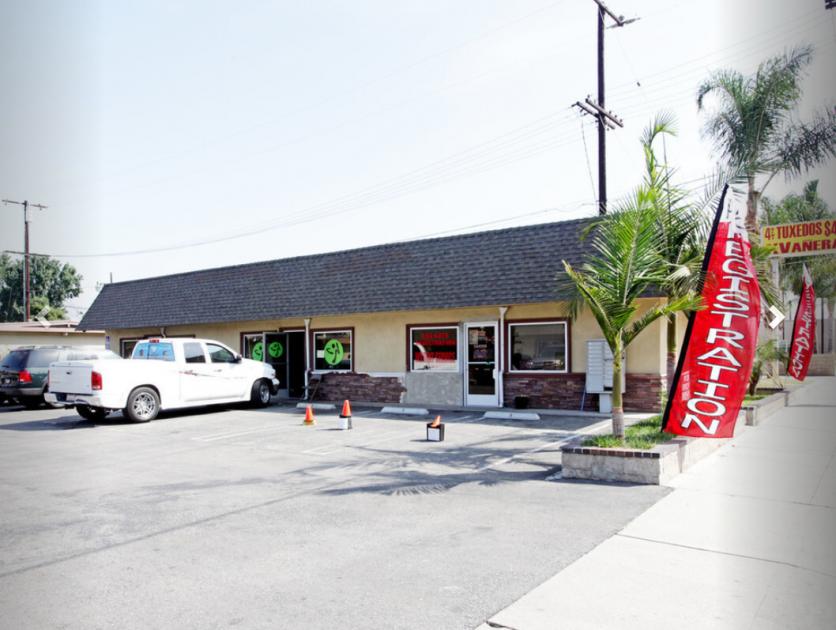
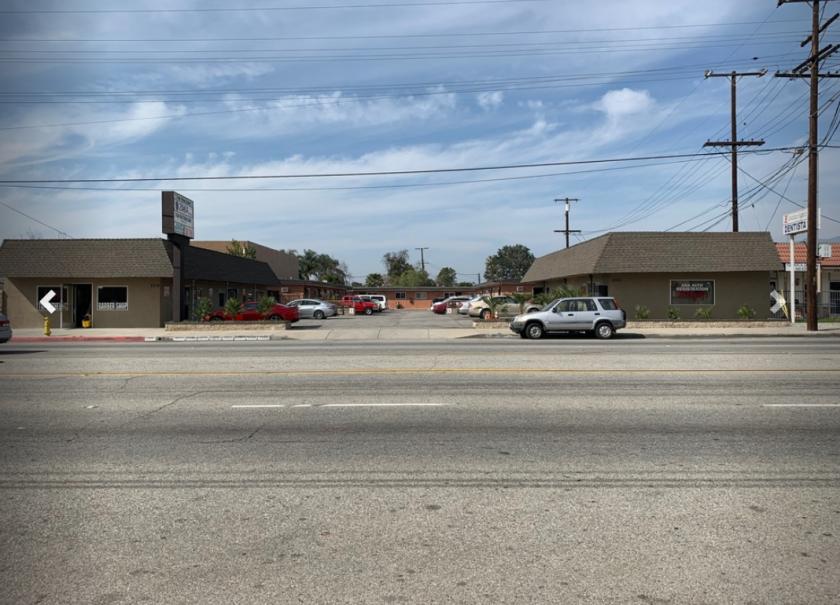
1-Mile | 3-Miles | 5-Miles | ||
---|---|---|---|---|
Total Population | 37,266 | 187,700 | 538,396 | |
Population Median Age | 35 | 37 | 39 | |
Population by Age | 0-9 Yrs | 5511 (14%) | 22626 (12%) | 59997 (11%) |
10-19 Yrs | 5497 (14%) | 25944 (13%) | 70518 (13%) | |
20-29 Yrs | 6247 (16%) | 30412 (16%) | 82267 (15%) | |
30-39 Yrs | 5051 (13%) | 24287 (12%) | 67664 (12%) | |
40-49 Yrs | 4790 (12%) | 25324 (13%) | 74389 (13%) | |
50-59 Yrs | 4860 (13%) | 24282 (12%) | 71377 (13%) | |
60-69 Yrs | 2790 (7%) | 17876 (9%) | 58769 (10%) | |
70+ Yrs | 2520 (6%) | 16949 (9%) | 53415 (9%) | |
Median HH Income | $50,365 | $55,617 | $64,457 | |
Total Household Income | < 24K | 1955 (21%) | 9661 (20%) | 25587 (17%) |
25-49K | 2521 (27%) | 11741 (24%) | 31984 (22%) | |
50-74K | 1915 (21%) | 9262 (19%) | 26158 (18%) | |
75-99K | 1074 (11%) | 6287 (13%) | 19681 (13%) | |
100-199K | 1400 (15%) | 8857 (18%) | 33972 (23%) | |
200K+ | 146 (1%) | 1304 (2%) | 7805 (5%) | |
Highest Education Level | No Diploma | 10139 | 47644 | 107717 |
Diploma or GED | 6858 | 34198 | 99648 | |
Some College | 3272 | 19463 | 63098 | |
Assoc. Degree | 970 | 6828 | 24448 | |
Bachelors Degree | 1677 | 12805 | 55156 | |
Higher Degree | 421 | 3589 | 18992 | |
Total Housing Units | 9,348 | 49,081 | 151,637 | |
--Owner-Occupied | 3,723 | 23,528 | 81,782 | |
--Renter-Occupied | 5,288 | 23,584 | 63,404 | |
Owner-Occupied Values | < 100K | 474 | 1738 | 3478 |
100-199K | 13 | 447 | 1235 | |
200-299K | 132 | 948 | 2712 | |
300-399K | 709 | 4545 | 13426 | |
400-499K | 1283 | 7682 | 21591 | |
500K+ | 1112 | 8168 | 39339 | |
Total Working Age Population | 28,398 | 149,650 | 436,295 | |
In Work Force | 18,165 | 90,598 | 268,009 | |
Not In Work Force | 10,233 | 59,051 | 168,286 | |
Workforce Employed | 16,822 | 84,834 | 253,054 | |
Workforce Unemployed | 1,340 | 5,725 | 14,791 | |
Civlian Workforce | 18,162 | 90,559 | 267,845 | |
Military Workforce | 3 | 39 | 164 | |
Total Households | 9,011 | 47,112 | 145,186 | |
Family Households | 7,506 | 39,148 | 118,383 | |
Non-Family Households | 1,505 | 7,965 | 26,803 | |
Married Couple | 4,290 | 24,384 | 79,698 | |
Other Family | 3,216 | 14,763 | 38,685 | |
Married w/Child | 1,885 | 9,856 | 32,533 | |
Single Male w/Child | 514 | 1,780 | 3,908 | |
Single Female w/Child | 999 | 3,899 | 9,203 |
Population Change Last Two Decades - Plus Projection
2000 | % | 2010 | % | 2020 | % | 2030 | |
---|---|---|---|---|---|---|---|
California | 33,871,648 | +10 | 37,253,956 | +9 | 40,467,295 | +8 | 43,631,295 |
Los Angeles County | 9,519,338 | +3 | 9,818,605 | +6 | 10,369,367 | +4 | 10,759,850 |
Total Working Age Population:
Total Households:
Total Working Age Population:
Total Households:
Total Working Age Population:
Total Households: