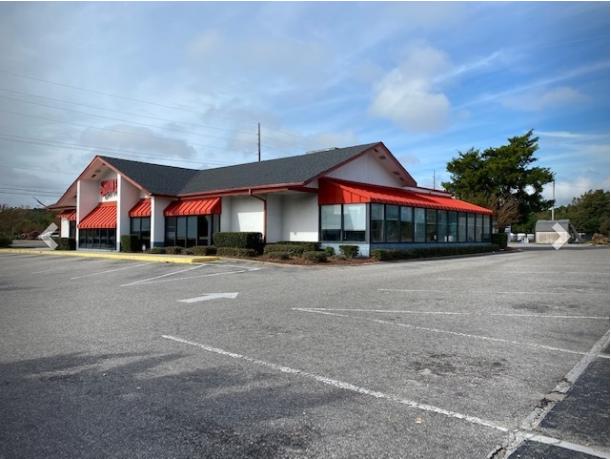
Fully equipped sit-down restaurant and bar
Tourism destination just 1 block from Beaches
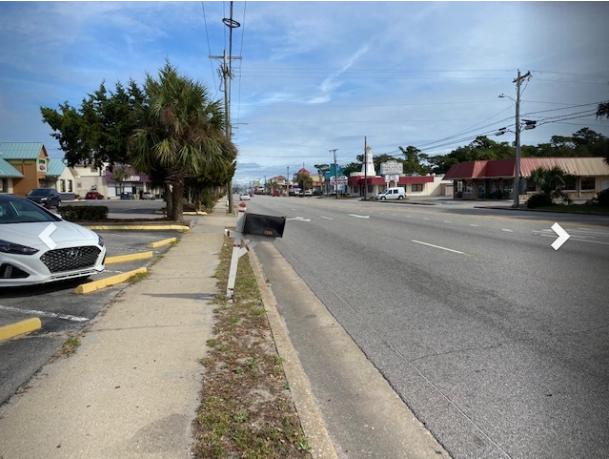
Signalized intersection on busy Kings Highway
Amusement district
All public utilities
Powerful visibility with 2 street side marquee signs
Both walk-by and drive-by traffic
Description
This is a fully equipped leisure dining restaurant within the heart of the amusement district of down town Myrtle Beach. Just one block form the beach. Corner location on busy Kings highway. Has walk-ins, grease traps and kitchen equipment, hood and all FF & E for an easy start-up for a variety of concepts. Has rive by and walk by traffic. great visibility, parking and access with lighted marquee signs.
Location
Signalized intersection in the heart of the City center. Great corner location for any number of dining concepts. Less than 1 mile from the Myrtle Beach epicenter and the Board walk. Within amusement district of the city and heart of tourism. One short block from Ocean and public beaches and 10,000 hotel rooms.
No part of this information may be copied, reproduced, repurposed, or screen-captured for any commercial purpose without prior written authorization from MyEListing.
While we strive to provide the most accurate information, all listing information, and demographic data, is provided by third-parties. As such, MyEListing will not be responsible for the accuracy of the information. It is strongly recommended that you verify all information with the listing agent, and any relevant agencies, prior to making any decisions.
What is the building size of this commercial Retail property?
The size of this lease property at '.1206 South Kings Highway.' is 5585 square feet
What kind of Retail is the propery at 1206 South Kings Highway?
The property at 1206 South Kings Highway Myrtle Beach, SC 29577 is listed as a Food Service Retail property
What is the population within 1 mile of 1206 South Kings Highway in Myrtle Beach?
The population within 1 mile of 1206 South Kings Highway Myrtle Beach, SC 29577 is 3,826 people.
Who do I contact for questions about 1206 South Kings Highway?
You should contact the listing agent,
Peter Perry, for any details regarding this commercial listing.