+/-1,500 SF building size
+/-3,025 SF lot size
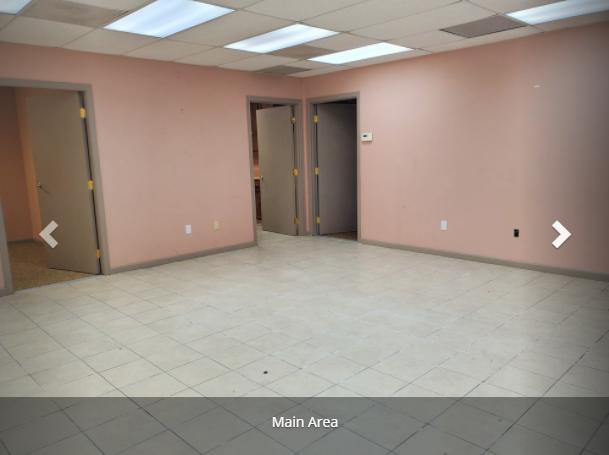
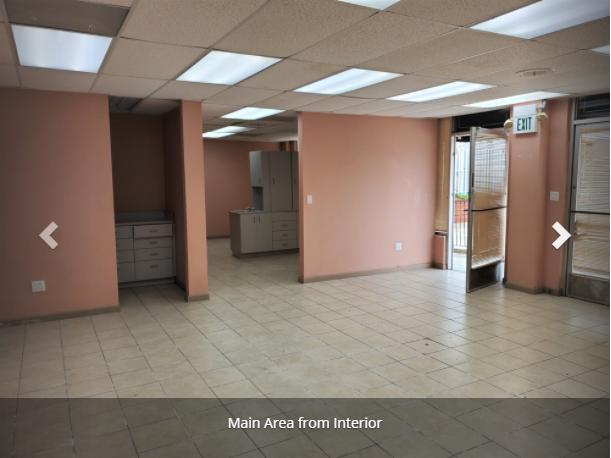
Large open area
Kitchen/Breakroom
Four dental exam rooms
ADA Bathroom (to be confirmed by Buyer)
Four off street parking spaces
Zoning Neighborhood Commercial (C-N) Chapter 12.96 San Bruno Municipal Code
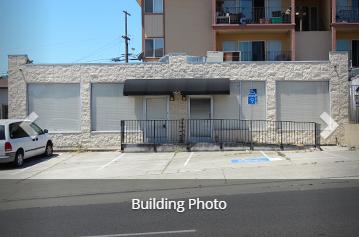
Description
Opportunity to purchase a small stand alone medical, office or retail building along high traffic El Camino Real. Property is ADA compatible and has 4 parking spaces including one ADA parking space. Currently built out as a dental office with plumbing already in place but not operating as a medical or dental office. Or just continue using as an office or a retail building.
Zoning Neighborhood Commercial (C-N) Chapter 12.96 San Bruno Municipal Code. Allowed Uses: Restaurants, Food Stores, Office Medical / Dental, etc. See Chapter 12.96 for additional uses.
Location
Located on busy El Camino Real, this office/retail or medical building offers many different opportunities for the savy business owner. San Bruno, California is located about 12 miles south of San Francisco, only a few miles from San Francisco International Airport and just north of Millbrae and Burlingame with Google and other major employers at your fingertips. This location can greatly benefit from all of the opportunities within the local area.
No part of this information may be copied, reproduced, repurposed, or screen-captured for any commercial purpose without prior written authorization from MyEListing.
While we strive to provide the most accurate information, all listing information, and demographic data, is provided by third-parties. As such, MyEListing will not be responsible for the accuracy of the information. It is strongly recommended that you verify all information with the listing agent, and any relevant agencies, prior to making any decisions.
What is the building size of this Office property in San Bruno, CA?
The size of the building/unit at 195 El Camino Real in San Bruno is 1,500 square feet
What kind of Office is the propery at 195 El Camino Real?
The property at 195 El Camino Real San Bruno, CA 94066 is listed as a Professional Office property
What is the population within 1 mile of 195 El Camino Real in San Bruno?
The population within 1 mile of 195 El Camino Real San Bruno, CA 94066 is 23,774 people.
Who do I contact for questions about 195 El Camino Real?
You should contact the listing agent,
David Collantes, for any details regarding this commercial listing.