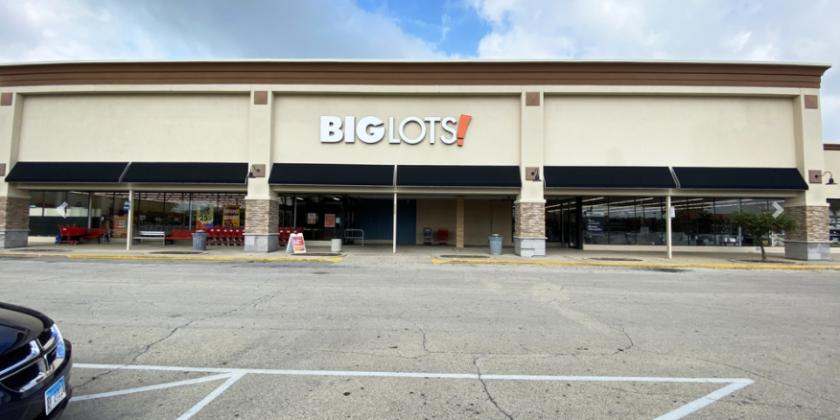
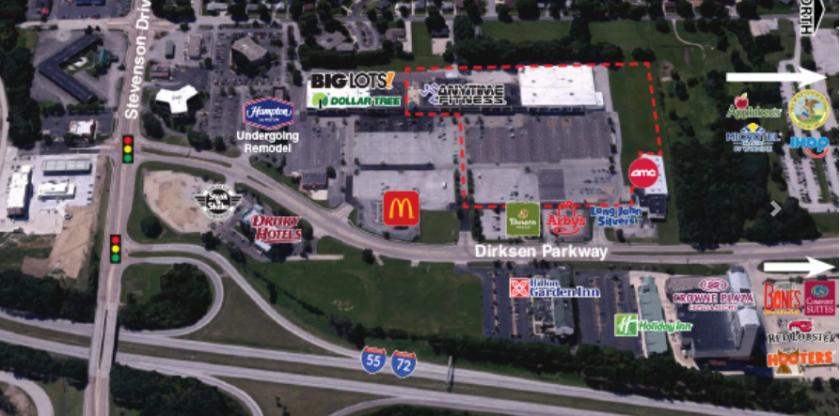
1-Mile | 3-Miles | 5-Miles | ||
---|---|---|---|---|
Total Population | 5,440 | 36,180 | 99,322 | |
Population Median Age | 37 | 37 | 39 | |
Population by Age | 0-9 Yrs | 895 (16%) | 4932 (13%) | 12589 (12%) |
10-19 Yrs | 679 (12%) | 5567 (15%) | 12137 (12%) | |
20-29 Yrs | 783 (14%) | 5113 (14%) | 14089 (14%) | |
30-39 Yrs | 605 (11%) | 4474 (12%) | 13246 (13%) | |
40-49 Yrs | 589 (10%) | 4221 (11%) | 11423 (11%) | |
50-59 Yrs | 690 (12%) | 4537 (12%) | 13003 (13%) | |
60-69 Yrs | 584 (10%) | 4002 (11%) | 12338 (12%) | |
70+ Yrs | 616 (11%) | 3334 (9%) | 10498 (10%) | |
Median HH Income | $56,388 | $49,257 | $49,955 | |
Total Household Income | < 24K | 591 (27%) | 4022 (28%) | 11183 (26%) |
25-49K | 388 (17%) | 3227 (22%) | 10311 (24%) | |
50-74K | 366 (16%) | 2547 (17%) | 7641 (17%) | |
75-99K | 374 (17%) | 1878 (13%) | 5094 (11%) | |
100-199K | 396 (18%) | 2264 (15%) | 6932 (16%) | |
200K+ | 43 (1%) | 400 (2%) | 1793 (4%) | |
Highest Education Level | No Diploma | 326 | 2740 | 6746 |
Diploma or GED | 1126 | 7279 | 19060 | |
Some College | 844 | 5588 | 15474 | |
Assoc. Degree | 219 | 1605 | 5022 | |
Bachelors Degree | 764 | 3915 | 13297 | |
Higher Degree | 288 | 2222 | 8337 | |
Total Housing Units | 2,288 | 15,904 | 47,960 | |
--Owner-Occupied | 1,557 | 9,032 | 25,817 | |
--Renter-Occupied | 600 | 5,305 | 17,138 | |
Owner-Occupied Values | < 100K | 688 | 4842 | 11505 |
100-199K | 619 | 2696 | 9465 | |
200-299K | 116 | 790 | 2603 | |
300-399K | 44 | 260 | 1004 | |
400-499K | 51 | 249 | 634 | |
500K+ | 40 | 195 | 606 | |
Total Working Age Population | 4,202 | 28,488 | 79,773 | |
In Work Force | 2,338 | 16,928 | 49,108 | |
Not In Work Force | 1,864 | 11,560 | 30,665 | |
Workforce Employed | 2,187 | 15,354 | 45,347 | |
Workforce Unemployed | 151 | 1,570 | 3,720 | |
Civlian Workforce | 2,338 | 16,924 | 49,067 | |
Military Workforce | 0 | 4 | 41 | |
Total Households | 2,157 | 14,337 | 42,955 | |
Family Households | 1,516 | 8,695 | 23,689 | |
Non-Family Households | 641 | 5,643 | 19,266 | |
Married Couple | 938 | 5,100 | 14,875 | |
Other Family | 578 | 3,594 | 8,814 | |
Married w/Child | 210 | 1,480 | 4,546 | |
Single Male w/Child | 131 | 411 | 1,050 | |
Single Female w/Child | 325 | 1,898 | 4,288 |
Population Change Last Two Decades - Plus Projection
2000 | % | 2010 | % | 2020 | % | 2030 | |
---|---|---|---|---|---|---|---|
Illinois | 12,419,293 | +3 | 12,830,632 | +12 | 14,316,487 | +6 | 15,138,849 |
Christian County | 35,372 | -2 | 34,800 | +15 | 40,053 | +1 | 40,601 |
Sangamon County | 188,951 | +5 | 197,465 | +7 | 210,672 | +6 | 222,367 |
Total Working Age Population:
Total Households:
Total Working Age Population:
Total Households:
Total Working Age Population:
Total Households: