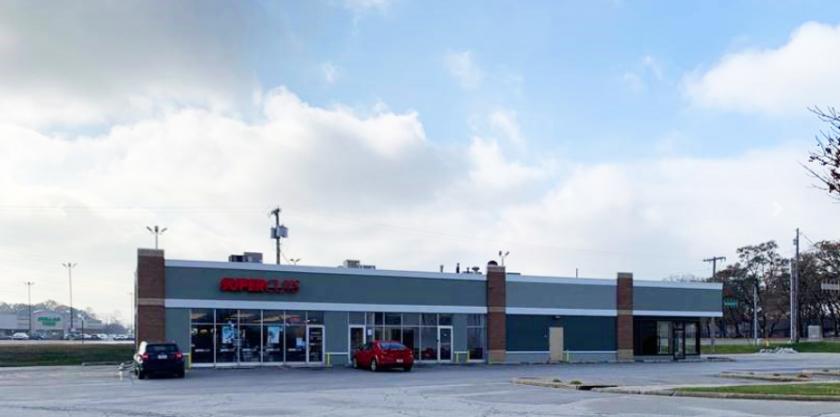
1-Mile | 3-Miles | 5-Miles | ||
---|---|---|---|---|
Total Population | 10,067 | 91,321 | 210,283 | |
Population Median Age | 41 | 40 | 39 | |
Population by Age | 0-9 Yrs | 1144 (11%) | 10938 (11%) | 26093 (12%) |
10-19 Yrs | 1145 (11%) | 11351 (12%) | 28218 (13%) | |
20-29 Yrs | 1258 (12%) | 11866 (12%) | 28047 (13%) | |
30-39 Yrs | 1238 (12%) | 11318 (12%) | 25966 (12%) | |
40-49 Yrs | 1230 (12%) | 11146 (12%) | 25728 (12%) | |
50-59 Yrs | 1635 (16%) | 13729 (15%) | 29485 (14%) | |
60-69 Yrs | 1189 (11%) | 10947 (11%) | 25469 (12%) | |
70+ Yrs | 1228 (12%) | 10026 (10%) | 21277 (10%) | |
Median HH Income | $68,860 | $62,760 | $56,067 | |
Total Household Income | < 24K | 564 (13%) | 5816 (16%) | 16796 (20%) |
25-49K | 779 (19%) | 7962 (22%) | 19309 (23%) | |
50-74K | 881 (21%) | 7584 (21%) | 16190 (19%) | |
75-99K | 649 (15%) | 4870 (13%) | 10579 (13%) | |
100-199K | 1024 (25%) | 7831 (21%) | 15489 (19%) | |
200K+ | 185 (4%) | 1798 (5%) | 3009 (3%) | |
Highest Education Level | No Diploma | 508 | 5577 | 15843 |
Diploma or GED | 2325 | 20395 | 47518 | |
Some College | 1648 | 14212 | 32813 | |
Assoc. Degree | 634 | 5500 | 12252 | |
Bachelors Degree | 1404 | 11965 | 22427 | |
Higher Degree | 712 | 5443 | 10818 | |
Total Housing Units | 4,312 | 38,571 | 90,327 | |
--Owner-Occupied | 3,430 | 27,199 | 57,128 | |
--Renter-Occupied | 652 | 8,661 | 24,244 | |
Owner-Occupied Values | < 100K | 462 | 6386 | 18558 |
100-199K | 1975 | 13021 | 25119 | |
200-299K | 747 | 5098 | 8571 | |
300-399K | 125 | 1247 | 2463 | |
400-499K | 60 | 686 | 1024 | |
500K+ | 59 | 762 | 1393 | |
Total Working Age Population | 8,158 | 73,234 | 167,758 | |
In Work Force | 5,548 | 47,265 | 106,329 | |
Not In Work Force | 2,610 | 25,969 | 61,429 | |
Workforce Employed | 5,281 | 44,581 | 97,853 | |
Workforce Unemployed | 267 | 2,661 | 8,378 | |
Civlian Workforce | 5,548 | 47,242 | 106,230 | |
Military Workforce | 0 | 23 | 99 | |
Total Households | 4,082 | 35,860 | 81,372 | |
Family Households | 2,656 | 23,334 | 52,135 | |
Non-Family Households | 1,426 | 12,526 | 29,237 | |
Married Couple | 2,037 | 16,664 | 33,407 | |
Other Family | 620 | 6,670 | 18,728 | |
Married w/Child | 714 | 6,241 | 12,526 | |
Single Male w/Child | 84 | 728 | 1,856 | |
Single Female w/Child | 251 | 2,595 | 7,622 |
Population Change Last Two Decades - Plus Projection
2000 | % | 2010 | % | 2020 | % | 2030 | |
---|---|---|---|---|---|---|---|
Illinois | 12,419,293 | +3 | 12,830,632 | +12 | 14,316,487 | +6 | 15,138,849 |
Cook County | 5,376,741 | -3 | 5,194,675 | +10 | 5,707,832 | +5 | 5,990,243 |
Will County | 502,266 | +35 | 677,560 | +34 | 907,625 | +20 | 1,093,207 |
Indiana | 6,080,485 | +7 | 6,483,802 | +4 | 6,738,573 | +4 | 7,014,880 |
Lake County | 484,564 | +2 | 496,005 | -3 | 479,815 | +1 | 482,321 |
Total Working Age Population:
Total Households:
Total Working Age Population:
Total Households:
Total Working Age Population:
Total Households: