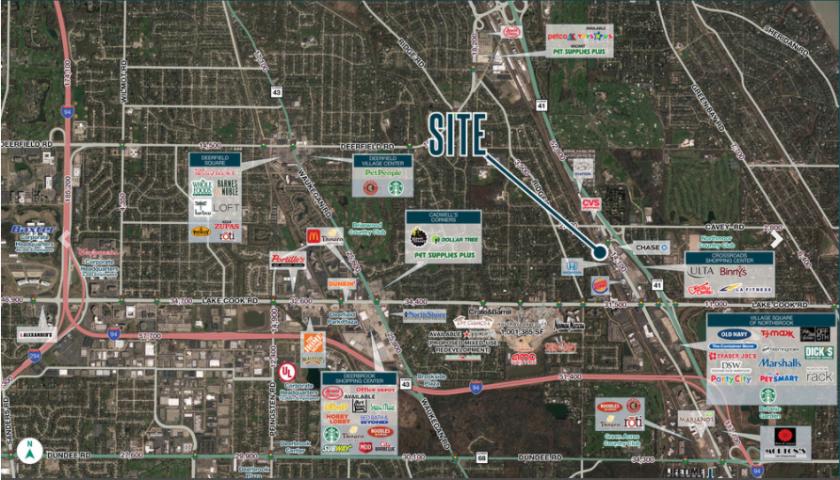
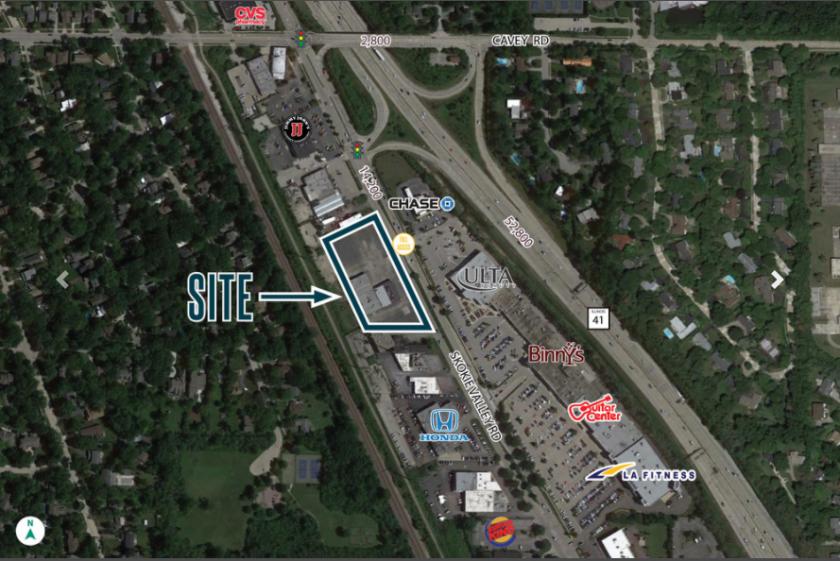
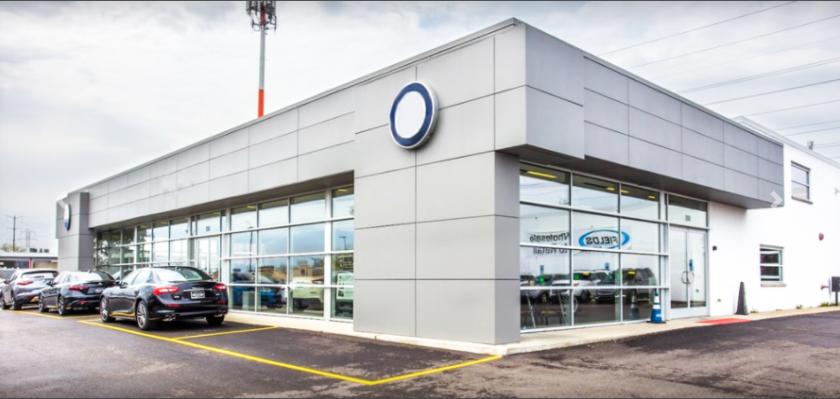
1-Mile | 3-Miles | 5-Miles | ||
---|---|---|---|---|
Total Population | 5,833 | 65,913 | 143,932 | |
Population Median Age | 47 | 43 | 43 | |
Population by Age | 0-9 Yrs | 607 (10%) | 7722 (11%) | 17631 (12%) |
10-19 Yrs | 758 (12%) | 9641 (14%) | 20848 (14%) | |
20-29 Yrs | 218 (3%) | 3631 (5%) | 8240 (5%) | |
30-39 Yrs | 418 (7%) | 5532 (8%) | 13157 (9%) | |
40-49 Yrs | 722 (12%) | 9430 (14%) | 19836 (13%) | |
50-59 Yrs | 866 (14%) | 10665 (16%) | 22116 (15%) | |
60-69 Yrs | 931 (15%) | 8932 (13%) | 19366 (13%) | |
70+ Yrs | 1313 (22%) | 10361 (15%) | 22739 (15%) | |
Median HH Income | $132,240 | $142,944 | $141,933 | |
Total Household Income | < 24K | 186 (7%) | 2128 (8%) | 4589 (8%) |
25-49K | 303 (13%) | 2612 (10%) | 5255 (9%) | |
50-74K | 225 (9%) | 2409 (9%) | 5520 (10%) | |
75-99K | 170 (7%) | 1972 (7%) | 4329 (7%) | |
100-199K | 700 (30%) | 7050 (27%) | 15312 (28%) | |
200K+ | 743 (31%) | 9093 (35%) | 19203 (35%) | |
Highest Education Level | No Diploma | 91 | 1023 | 2565 |
Diploma or GED | 431 | 4118 | 8941 | |
Some College | 459 | 5285 | 11224 | |
Assoc. Degree | 125 | 1285 | 3281 | |
Bachelors Degree | 1615 | 17079 | 36145 | |
Higher Degree | 1579 | 17421 | 38154 | |
Total Housing Units | 2,531 | 27,128 | 58,162 | |
--Owner-Occupied | 2,051 | 21,256 | 45,345 | |
--Renter-Occupied | 276 | 4,007 | 8,864 | |
Owner-Occupied Values | < 100K | 35 | 268 | 599 |
100-199K | 92 | 878 | 1730 | |
200-299K | 177 | 1744 | 3328 | |
300-399K | 391 | 2755 | 5012 | |
400-499K | 273 | 3016 | 6607 | |
500K+ | 1084 | 12595 | 28068 | |
Total Working Age Population | 4,694 | 51,880 | 112,915 | |
In Work Force | 2,780 | 32,673 | 68,887 | |
Not In Work Force | 1,914 | 19,208 | 44,028 | |
Workforce Employed | 2,664 | 31,614 | 66,373 | |
Workforce Unemployed | 116 | 1,051 | 2,143 | |
Civlian Workforce | 2,780 | 32,665 | 68,516 | |
Military Workforce | 0 | 7 | 370 | |
Total Households | 2,327 | 25,263 | 54,208 | |
Family Households | 1,693 | 18,738 | 40,666 | |
Non-Family Households | 634 | 6,525 | 13,543 | |
Married Couple | 1,573 | 16,795 | 36,616 | |
Other Family | 120 | 1,943 | 4,050 | |
Married w/Child | 567 | 7,175 | 15,840 | |
Single Male w/Child | 17 | 292 | 504 | |
Single Female w/Child | 81 | 904 | 1,641 |
Population Change Last Two Decades - Plus Projection
2000 | % | 2010 | % | 2020 | % | 2030 | |
---|---|---|---|---|---|---|---|
Illinois | 12,419,293 | +3 | 12,830,632 | +12 | 14,316,487 | +6 | 15,138,849 |
Cook County | 5,376,741 | -3 | 5,194,675 | +10 | 5,707,832 | +5 | 5,990,243 |
Lake County | 644,356 | +9 | 703,462 | +17 | 820,250 | +6 | 873,024 |
Total Working Age Population:
Total Households:
Total Working Age Population:
Total Households:
Total Working Age Population:
Total Households: