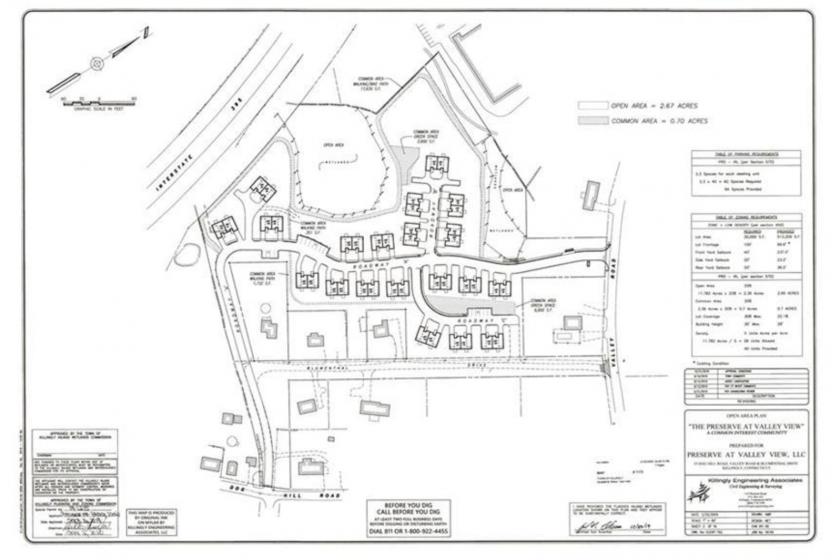
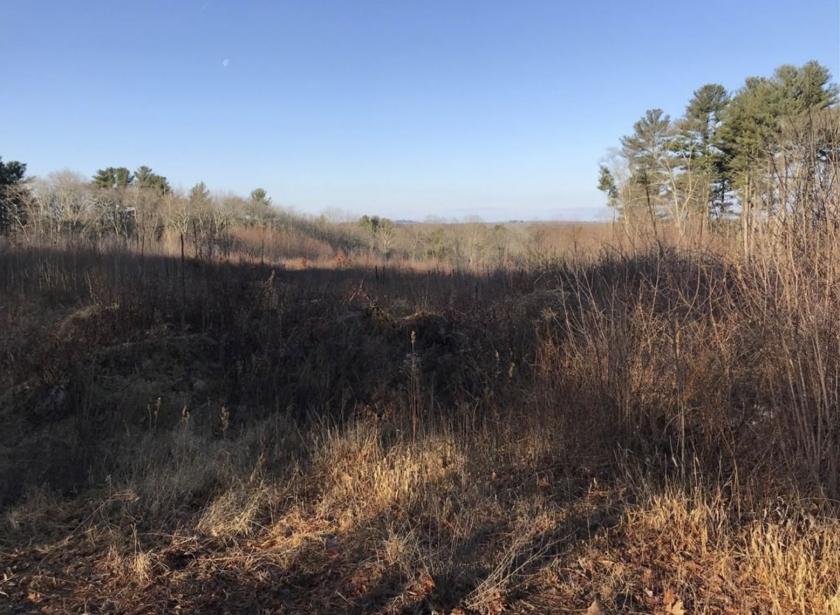
Great opportunity for multi-family developer. 10.8 acres, Fully approved 20 duplex (40 unit) condominium complex. Shovel ready. Located a couple minutes drive off exit 41 off I-395 in Killingly. Near Killingly Commons shopping center and in the heart of the commercial retail area. Full plan including architectural drawings available. Large footprint design with a lot of flexibility for configuration of units.
All information based on the most recently available data (updated annually) and is provided in 1-mile, 3-mile, and 5-mile radii (radiuses) of the property location.
1-Mile | 3-Miles | 5-Miles | ||
---|---|---|---|---|
Total Population | 1,323 | 13,485 | 25,126 | |
Population Median Age | 42 | 41 | 41 | |
Population by Age | 0-9 Yrs | 181 (13%) | 1677 (12%) | 2755 (10%) |
10-19 Yrs | 125 (9%) | 1336 (9%) | 2854 (11%) | |
20-29 Yrs | 124 (9%) | 1635 (12%) | 2755 (10%) | |
30-39 Yrs | 188 (14%) | 1849 (13%) | 3245 (12%) | |
40-49 Yrs | 173 (13%) | 1655 (12%) | 3140 (12%) | |
50-59 Yrs | 182 (13%) | 2219 (16%) | 4175 (16%) | |
60-69 Yrs | 153 (11%) | 1664 (12%) | 3374 (13%) | |
70+ Yrs | 196 (14%) | 1450 (10%) | 2827 (11%) | |
Median HH Income | $58,522 | $58,552 | $65,183 | |
Total Household Income | < 24K | 163 (28%) | 1299 (22%) | 1943 (19%) |
25-49K | 96 (16%) | 1142 (20%) | 1947 (19%) | |
50-74K | 95 (16%) | 1018 (17%) | 1744 (17%) | |
75-99K | 54 (9%) | 740 (13%) | 1377 (13%) | |
100-199K | 155 (26%) | 1243 (21%) | 2487 (24%) | |
200K+ | 16 (2%) | 220 (3%) | 499 (4%) | |
Highest Education Level | No Diploma | 143 | 1358 | 2238 |
Diploma or GED | 307 | 3261 | 5995 | |
Some College | 170 | 2034 | 3885 | |
Assoc. Degree | 91 | 988 | 1973 | |
Bachelors Degree | 144 | 1334 | 2643 | |
Higher Degree | 104 | 787 | 1613 | |
Total Housing Units | 651 | 6,508 | 11,250 | |
--Owner-Occupied | 375 | 3,483 | 6,872 | |
--Renter-Occupied | 205 | 2,180 | 3,124 | |
Owner-Occupied Values | < 100K | 33 | 287 | 400 |
100-199K | 159 | 1713 | 2908 | |
200-299K | 115 | 942 | 2275 | |
300-399K | 45 | 294 | 706 | |
400-499K | 16 | 149 | 349 | |
500K+ | 7 | 98 | 234 | |
Total Working Age Population | 1,059 | 10,873 | 20,521 | |
In Work Force | 674 | 7,493 | 13,443 | |
Not In Work Force | 385 | 3,380 | 7,078 | |
Workforce Employed | 646 | 7,180 | 12,787 | |
Workforce Unemployed | 28 | 311 | 633 | |
Civlian Workforce | 674 | 7,491 | 13,420 | |
Military Workforce | 0 | 1 | 23 | |
Total Households | 580 | 5,662 | 9,997 | |
Family Households | 311 | 3,350 | 6,387 | |
Non-Family Households | 269 | 2,312 | 3,610 | |
Married Couple | 238 | 2,369 | 4,752 | |
Other Family | 72 | 981 | 1,635 | |
Married w/Child | 83 | 782 | 1,478 | |
Single Male w/Child | 11 | 121 | 238 | |
Single Female w/Child | 38 | 522 | 785 |
Population Change Last Two Decades - Plus Projection
2000 | % | 2010 | % | 2020 | % | 2030 | |
---|---|---|---|---|---|---|---|
Connecticut | 3,405,565 | +5 | 3,574,097 | +1 | 3,604,603 | +1 | 3,633,994 |
Windham County | 109,091 | +9 | 118,428 | +5 | 124,498 | +5 | 130,497 |
Rhode Island | 1,048,319 | 0 | 1,052,567 | 0 | 1,049,177 | +2 | 1,070,677 |
Providence County | 621,602 | +1 | 626,667 | 0 | 627,214 | +2 | 639,847 |
No part of this information may be copied, reproduced, repurposed, or screen-captured for any commercial purpose without prior written authorization from MyEListing.
While we strive to provide the most accurate information, all listing information, and demographic data, is provided by third-parties. As such, MyEListing will not be responsible for the accuracy of the information. It is strongly recommended that you verify all information with the listing agent, and any relevant agencies, prior to making any decisions.