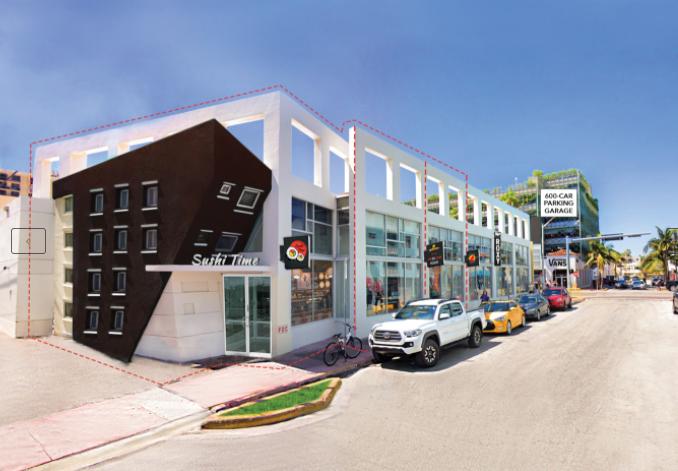
Restaurant/Retail Spaces For Lease in Collins Ave
Prime retail location in the heart of the Collins Avenue “Fashion District”
Opportunity for retail and fast-casual restaurants with restaurant infrastructure
Steps to Ocean Drive and the beaches
Multiple hotels within walking distance
Strategically located between the beach and the main parking garages in the area
NEIGHBORING TENANTS INCLUDE:
Dash, Free People, H&M, MAC Cosmetics, Sephora, Sunglass Hut, Vans, Victoria's Seccret
No part of this information may be copied, reproduced, repurposed, or screen-captured for any commercial purpose without prior written authorization from MyEListing.
While we strive to provide the most accurate information, all listing information, and demographic data, is provided by third-parties. As such, MyEListing will not be responsible for the accuracy of the information. It is strongly recommended that you verify all information with the listing agent, and any relevant agencies, prior to making any decisions.
What is the building size of this commercial Retail property?
The size of this lease property at '.673 Collins Avenue.' is 5150 square feet
What kind of Retail is the propery at 673 Collins Avenue?
The property at 673 Collins Avenue Miami Beach, FL 33139 is listed as a Food Service Retail property
What is the population within 1 mile of 673 Collins Avenue in Miami Beach?
The population within 1 mile of 673 Collins Avenue Miami Beach, FL 33139 is 35,668 people.
Who do I contact for questions about 673 Collins Avenue?
You should contact the listing agent,
Michael Comras, for any details regarding this commercial listing.