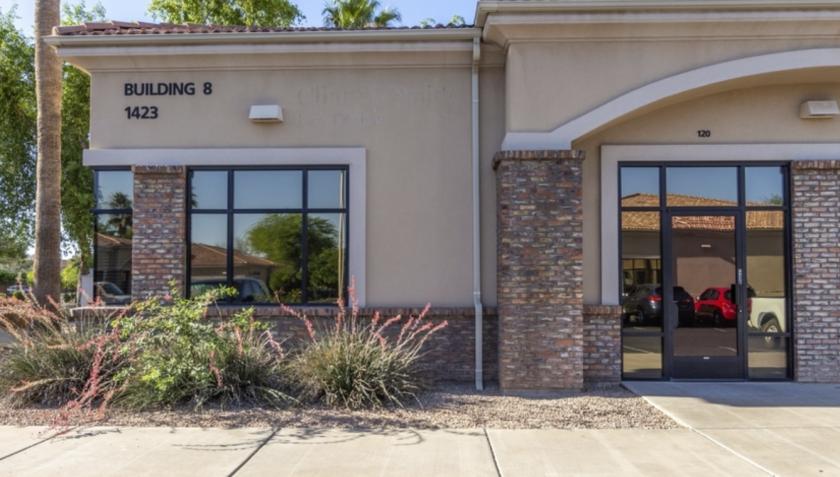
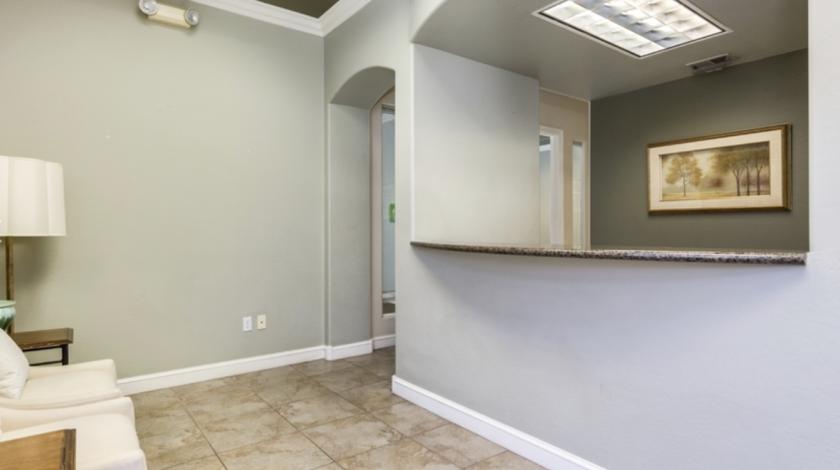
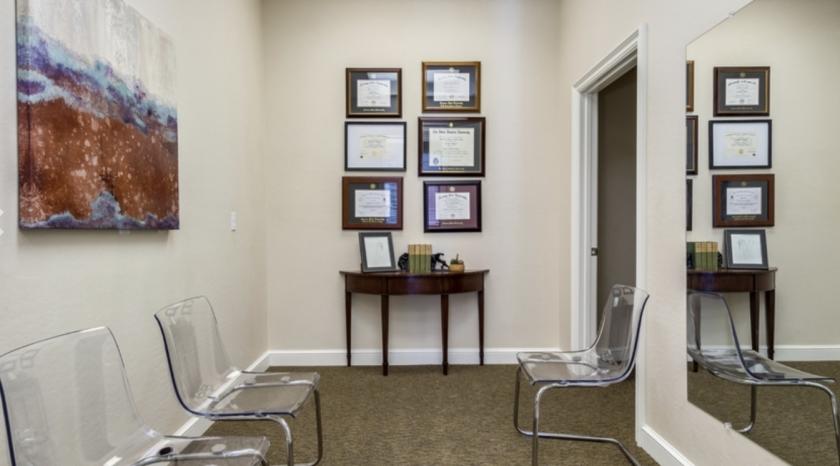
Description
Built-out office space located on the SEC of Higley Road and Hampton Avenue. This 1,800 SF office offers plenty of parking, monument and building signage opportunities, and pristine landscaping throughout the Plaza. Frontage on Higley Road and located just north of the US-60 Freeway. Located within close proximity to multiple retail and business amenities, including Banner Gateway Medical Center.
Highlights
Professional Office Space Available for Sale
Approximately 1,800 SF
For Sale: 396,000 ($220.00 PSF)
Part of Entrada Executive Plaza
Desirable East Valley Location
Convenient Access to US 60 Freeway
Near Business and Retail Amenities
Ample Parking
Monument and Building Signage Opportunitie
No part of this information may be copied, reproduced, repurposed, or screen-captured for any commercial purpose without prior written authorization from MyEListing.
While we strive to provide the most accurate information, all listing information, and demographic data, is provided by third-parties. As such, MyEListing will not be responsible for the accuracy of the information. It is strongly recommended that you verify all information with the listing agent, and any relevant agencies, prior to making any decisions.
What is the building size of this Office property in Mesa, AZ?
The size of the building/unit at 1423 South Higley Road in Mesa is 1,800 square feet
What kind of Office is the propery at 1423 South Higley Road?
The property at 1423 South Higley Road Mesa, AZ 85206 is listed as a Medical Office property
What is the population within 1 mile of 1423 South Higley Road in Mesa?
The population within 1 mile of 1423 South Higley Road Mesa, AZ 85206 is 12,415 people.
Who do I contact for questions about 1423 South Higley Road?
You should contact the listing agent,
Grafton Milne, for any details regarding this commercial listing.