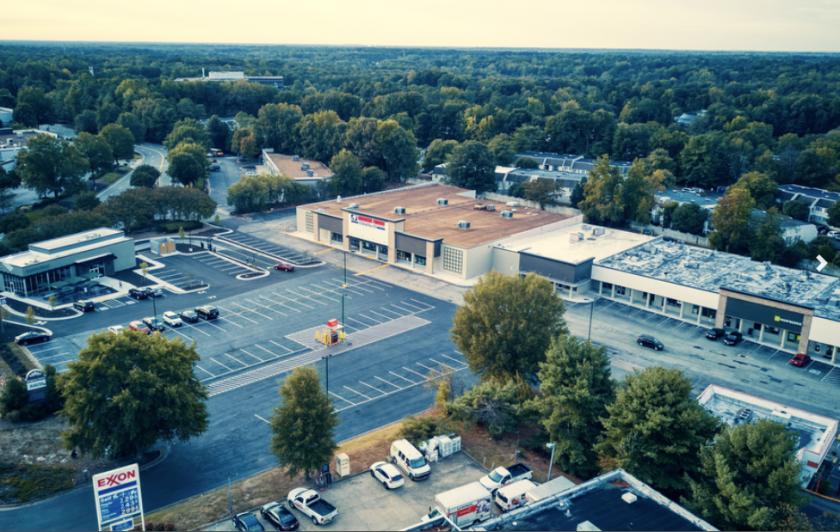
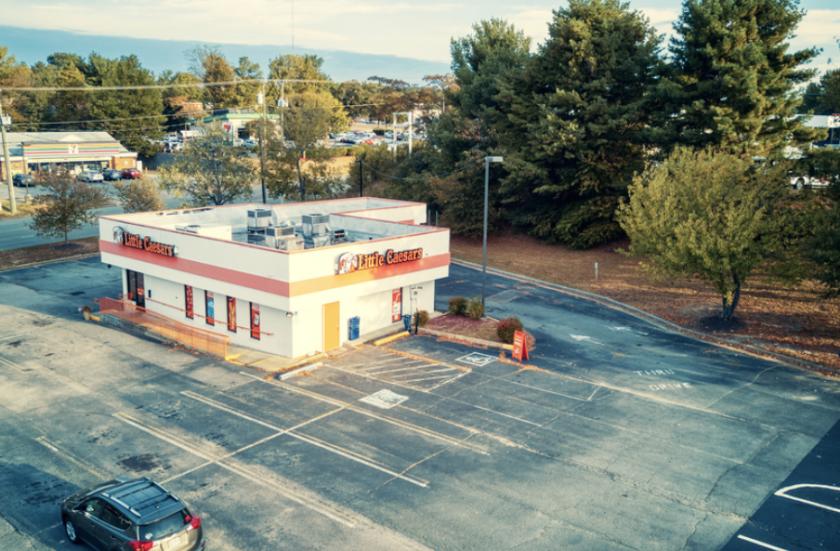
1-Mile | 3-Miles | 5-Miles | ||
---|---|---|---|---|
Total Population | 5,691 | 57,023 | 162,246 | |
Population Median Age | 41 | 40 | 39 | |
Population by Age | 0-9 Yrs | 573 (10%) | 6434 (11%) | 20148 (12%) |
10-19 Yrs | 894 (15%) | 7406 (12%) | 19587 (12%) | |
20-29 Yrs | 590 (10%) | 7192 (12%) | 20034 (12%) | |
30-39 Yrs | 779 (13%) | 8064 (14%) | 22803 (14%) | |
40-49 Yrs | 638 (11%) | 7198 (12%) | 21080 (12%) | |
50-59 Yrs | 763 (13%) | 7443 (13%) | 22367 (13%) | |
60-69 Yrs | 687 (12%) | 7102 (12%) | 20307 (12%) | |
70+ Yrs | 769 (13%) | 6185 (10%) | 15920 (9%) | |
Median HH Income | $69,256 | $72,735 | $69,691 | |
Total Household Income | < 24K | 272 (12%) | 2451 (10%) | 8942 (14%) |
25-49K | 506 (23%) | 4696 (20%) | 13532 (21%) | |
50-74K | 380 (17%) | 4429 (19%) | 11033 (17%) | |
75-99K | 377 (17%) | 3570 (15%) | 8684 (13%) | |
100-199K | 495 (23%) | 5947 (26%) | 15880 (25%) | |
200K+ | 90 (4%) | 1275 (5%) | 4553 (7%) | |
Highest Education Level | No Diploma | 301 | 3197 | 10633 |
Diploma or GED | 1052 | 8731 | 25522 | |
Some College | 965 | 8742 | 23243 | |
Assoc. Degree | 361 | 2881 | 8842 | |
Bachelors Degree | 765 | 10028 | 27702 | |
Higher Degree | 558 | 6418 | 18282 | |
Total Housing Units | 2,407 | 23,833 | 66,639 | |
--Owner-Occupied | 1,631 | 15,234 | 42,125 | |
--Renter-Occupied | 490 | 7,135 | 20,500 | |
Owner-Occupied Values | < 100K | 92 | 666 | 1955 |
100-199K | 627 | 5096 | 14082 | |
200-299K | 857 | 6568 | 14435 | |
300-399K | 36 | 1816 | 5892 | |
400-499K | 1 | 738 | 2847 | |
500K+ | 18 | 349 | 2913 | |
Total Working Age Population | 4,587 | 46,242 | 129,788 | |
In Work Force | 2,797 | 31,540 | 88,518 | |
Not In Work Force | 1,790 | 14,702 | 41,269 | |
Workforce Employed | 2,654 | 30,115 | 83,685 | |
Workforce Unemployed | 141 | 1,288 | 4,540 | |
Civlian Workforce | 2,795 | 31,403 | 88,225 | |
Military Workforce | 1 | 137 | 293 | |
Total Households | 2,120 | 22,369 | 62,624 | |
Family Households | 1,455 | 14,456 | 40,536 | |
Non-Family Households | 665 | 7,913 | 22,089 | |
Married Couple | 1,153 | 10,492 | 29,032 | |
Other Family | 302 | 3,964 | 11,504 | |
Married w/Child | 458 | 3,986 | 10,515 | |
Single Male w/Child | 20 | 471 | 1,170 | |
Single Female w/Child | 100 | 1,411 | 4,619 |
Population Change Last Two Decades - Plus Projection
2000 | % | 2010 | % | 2020 | % | 2030 | |
---|---|---|---|---|---|---|---|
Virginia | 7,078,515 | +13 | 8,001,024 | +8 | 8,655,021 | +8 | 9,331,666 |
Amelia County | 11,400 | +11 | 12,690 | +3 | 13,088 | +5 | 13,792 |
Chesterfield County | 259,903 | +22 | 316,236 | +12 | 353,841 | +12 | 396,647 |
Hanover County | 86,320 | +16 | 99,863 | +9 | 109,244 | +9 | 119,360 |
Henrico County | 262,300 | +17 | 306,935 | +8 | 332,103 | +9 | 363,259 |
Powhatan County | 22,377 | +25 | 28,046 | +7 | 29,909 | +12 | 33,440 |
Richmond city | 197,790 | +3 | 204,214 | +14 | 232,533 | +6 | 245,483 |
Total Working Age Population:
Total Households:
Total Working Age Population:
Total Households:
Total Working Age Population:
Total Households: