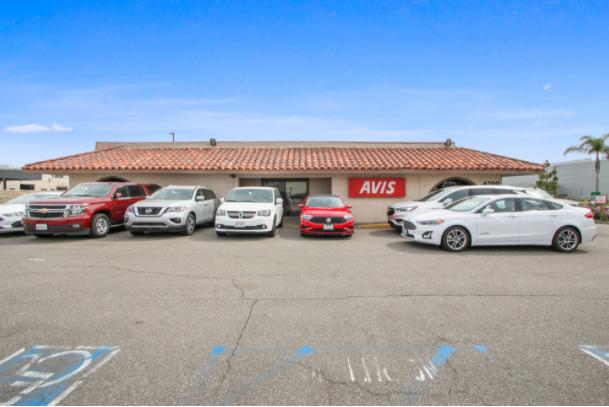
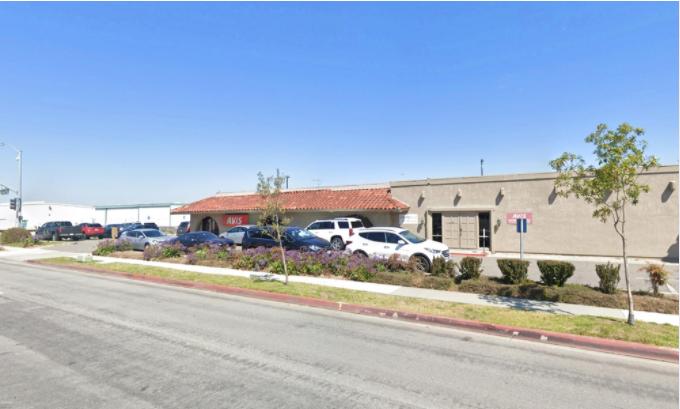
Lee & Associates Commercial Real Estate Services, Inc. - Orange is pleased to offer for sale this unique single-tenant net leased investment opportunity located at 4200 Campus Dr., Newport Beach, California. This freestanding building comprised of approximately 11,060 square feet is ideally located in Newport Beach with street frontage on Campus Drive across the street from John Wayne Airport.
The property is situated on an approximate 31,900 square foot land parcel. This asset is a value-added opportunity for an investor looking for a great long term hold in the Newport Beach/Orange County market area with future development upside.
The current tenant has occupied 100% of the building since 2009 and occupies several other properties in the immediate area as well.
Highlights
±11,060 SF Freestanding Office Building
±8,000 SF Office Space
31,900 SF Lot
Street Frontage on Campus Drive
Freestanding Building in Desirable Newport Beach, California
Excellent Freeway Access to I-405, 55 Freeways, as well as 73 Toll Road
Unique Zoning and Entitlements for Rental Car Facility
Owner User Opportunity / Redevelopment Upside
Adjacent to John Wayne Airport (SNA)
7% Cap Rate NNN Lease with Credit Tenant Avis
Permit for Car Rental/Sales
Possible Buyer Occupancy
Property Details
No part of this information may be copied, reproduced, repurposed, or screen-captured for any commercial purpose without prior written authorization from MyEListing.
While we strive to provide the most accurate information, all listing information, and demographic data, is provided by third-parties. As such, MyEListing will not be responsible for the accuracy of the information. It is strongly recommended that you verify all information with the listing agent, and any relevant agencies, prior to making any decisions.
What is the asking price for 4200 Campus Drive in Newport Beach?
The asking price for 4200 Campus Drive is $6,147,000
What is the building size of this Retail property in Newport Beach, CA?
The size of the building/unit at 4200 Campus Drive in Newport Beach is 11,060 square feet
How much land does the Newport Beach, CA property at 4200 Campus Drive include?
4200 Campus Drive in Newport Beach includes 0.732 acres of land
What kind of Retail is the propery at 4200 Campus Drive?
The property at 4200 Campus Drive Newport Beach, CA 92660 is listed as a Vehicle Sales/Service Retail property
What is the population within 1 mile of 4200 Campus Drive in Newport Beach?
The population within 1 mile of 4200 Campus Drive Newport Beach, CA 92660 is 7,620 people.
Who do I contact for questions about 4200 Campus Drive?
You should contact the listing agent,
Jack Haley, for any details regarding this commercial listing.