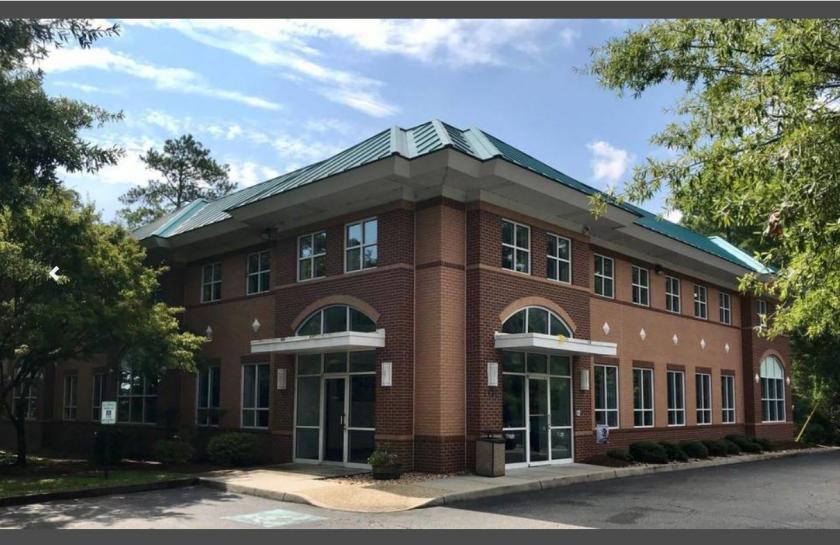
1-Mile | 3-Miles | 5-Miles | ||
---|---|---|---|---|
Total Population | 12,947 | 63,358 | 116,919 | |
Population Median Age | 36 | 39 | 39 | |
Population by Age | 0-9 Yrs | 1266 (9%) | 6537 (10%) | 12574 (10%) |
10-19 Yrs | 1242 (9%) | 7376 (11%) | 14498 (12%) | |
20-29 Yrs | 3501 (27%) | 11224 (17%) | 19502 (16%) | |
30-39 Yrs | 2191 (16%) | 8914 (14%) | 15547 (13%) | |
40-49 Yrs | 1230 (9%) | 7327 (11%) | 13789 (11%) | |
50-59 Yrs | 1475 (11%) | 8485 (13%) | 15760 (13%) | |
60-69 Yrs | 1098 (8%) | 7049 (11%) | 13347 (11%) | |
70+ Yrs | 943 (7%) | 6446 (10%) | 11903 (10%) | |
Median HH Income | $55,674 | $70,574 | $74,823 | |
Total Household Income | < 24K | 956 (15%) | 3479 (12%) | 5188 (10%) |
25-49K | 1730 (28%) | 5978 (21%) | 9934 (21%) | |
50-74K | 1269 (21%) | 5090 (18%) | 8552 (18%) | |
75-99K | 774 (12%) | 3717 (13%) | 6529 (13%) | |
100-199K | 844 (14%) | 6239 (22%) | 11821 (25%) | |
200K+ | 414 (6%) | 2841 (10%) | 5204 (11%) | |
Highest Education Level | No Diploma | 590 | 2513 | 4811 |
Diploma or GED | 1807 | 7757 | 14491 | |
Some College | 2333 | 9953 | 18364 | |
Assoc. Degree | 1168 | 4377 | 8204 | |
Bachelors Degree | 1704 | 11730 | 20641 | |
Higher Degree | 1125 | 7359 | 13831 | |
Total Housing Units | 6,690 | 31,414 | 52,710 | |
--Owner-Occupied | 1,839 | 14,092 | 27,672 | |
--Renter-Occupied | 4,149 | 13,251 | 19,556 | |
Owner-Occupied Values | < 100K | 53 | 414 | 1162 |
100-199K | 382 | 2055 | 3842 | |
200-299K | 506 | 2279 | 5380 | |
300-399K | 369 | 2569 | 4880 | |
400-499K | 76 | 2176 | 3407 | |
500K+ | 453 | 4599 | 9001 | |
Total Working Age Population | 10,921 | 52,222 | 95,544 | |
In Work Force | 8,381 | 37,259 | 66,973 | |
Not In Work Force | 2,540 | 14,964 | 28,571 | |
Workforce Employed | 7,437 | 32,429 | 57,561 | |
Workforce Unemployed | 432 | 1,604 | 2,646 | |
Civlian Workforce | 7,869 | 34,033 | 60,207 | |
Military Workforce | 512 | 3,226 | 6,766 | |
Total Households | 5,988 | 27,344 | 47,228 | |
Family Households | 3,003 | 16,057 | 30,425 | |
Non-Family Households | 2,985 | 11,287 | 16,804 | |
Married Couple | 1,841 | 11,291 | 22,645 | |
Other Family | 1,162 | 4,766 | 7,779 | |
Married w/Child | 619 | 3,855 | 8,412 | |
Single Male w/Child | 200 | 936 | 1,371 | |
Single Female w/Child | 558 | 2,116 | 3,246 |
Population Change Last Two Decades - Plus Projection
2000 | % | 2010 | % | 2020 | % | 2030 | |
---|---|---|---|---|---|---|---|
Virginia | 7,078,515 | +13 | 8,001,024 | +8 | 8,655,021 | +8 | 9,331,666 |
Chesapeake city | 199,184 | +12 | 222,209 | +12 | 249,244 | +9 | 270,506 |
Virginia Beach city | 425,257 | +3 | 437,994 | +4 | 457,699 | +2 | 467,187 |
Total Working Age Population:
Total Households:
Total Working Age Population:
Total Households:
Total Working Age Population:
Total Households: