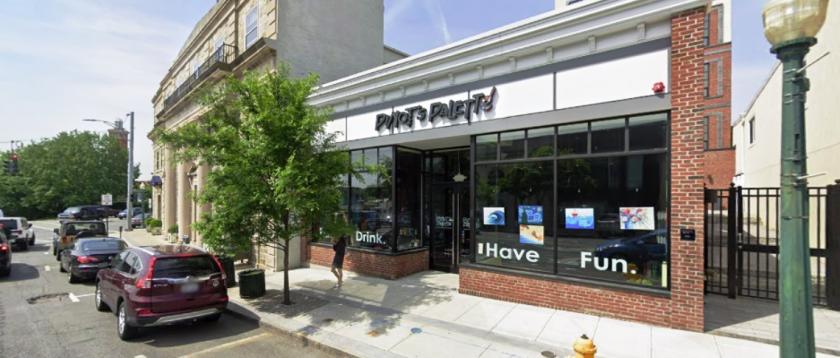
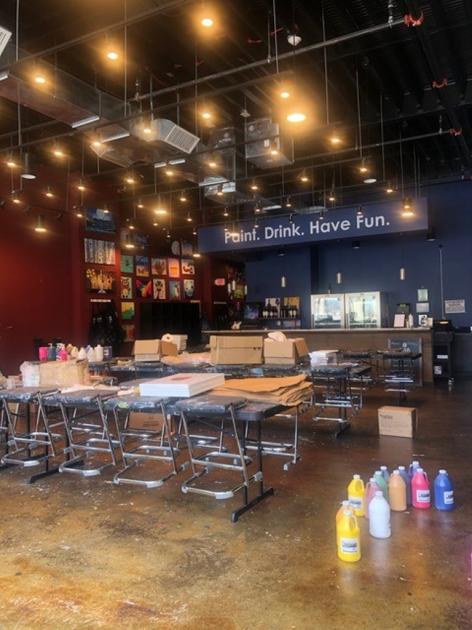
Admiral Real Estate Services exclusively present the 2,000 square foot space at 108 Mamaroneck Avenue, Mamaroneck, NY. This Mamaroneck retail space is located at the busy intersection of Mamaroneck Avenue and Boston Post Road. The traffic count on Boston Post Road is over 17,000 vehicles per day. Most important, the space can be seen from the vibrant signalized intersection and it has the frontage of 35 feet.This Mamaroneck retail space can also be used as office space, restaurant/ food use, or medical. It is currently built out as art studio, which boasts high ceilings. Further, it features an open floor plan and has an industrialized style. Additionally, there is a 1,100 square foot lower level that is included in the rental rate.The space is situated in a spot with views of Harbor Island Park. In addition, other retailers on this prime Mamaroneck shopping street include Piccolo Mulino Italian restaurant, KCO Kickboxing, Wells Fargo, Dunkin’ Donuts, Chase, Mister Chen restaurant, Miller’s Toy Store, Salsa Fresca, AT&T, and many more local favorites!Ultra Prime Downtown Mamaroneck Street Front RetailBeautiful Industrial-Style Space with 16 Ft Ceilings & Concrete Floorituated Near Corner of Main Road by Busy Signalized Intersection Located at Mamaroneck Ave and Boston Post Road1,100 SF Lower Level Included in Rent; Full Ceiling Height in Lower Level35 Feet of FrontageMunicipal Parking in Rear; Ample Street ParkingIdeal for Fitness, Kids’ Classes/Services and/or Restaurant/Food UseOffice, Medical & Urgent Care Uses AllowedSpace Features Views of the Harbor