Industrial Properties
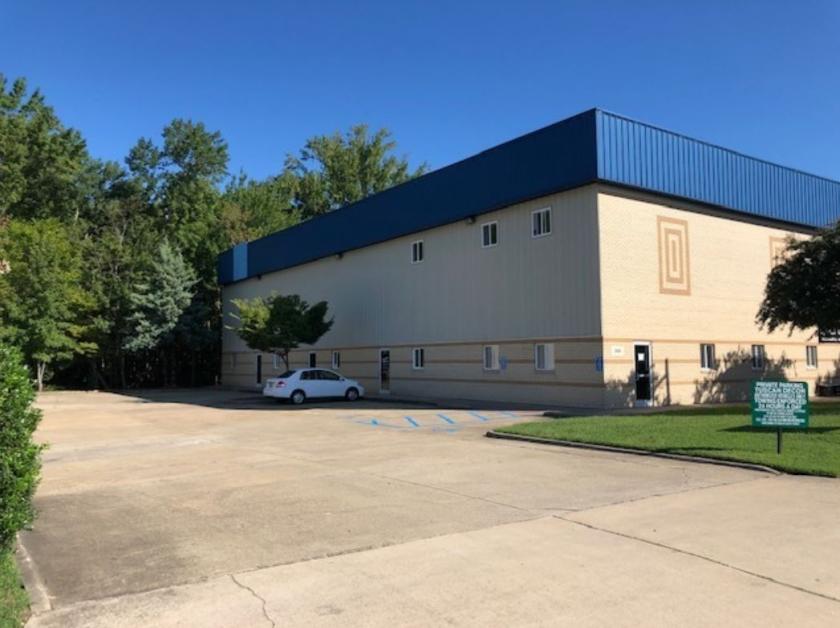
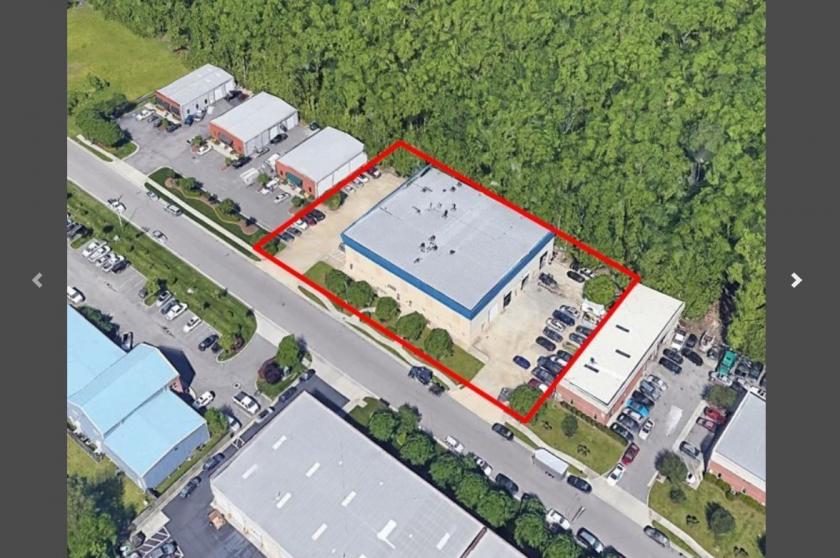
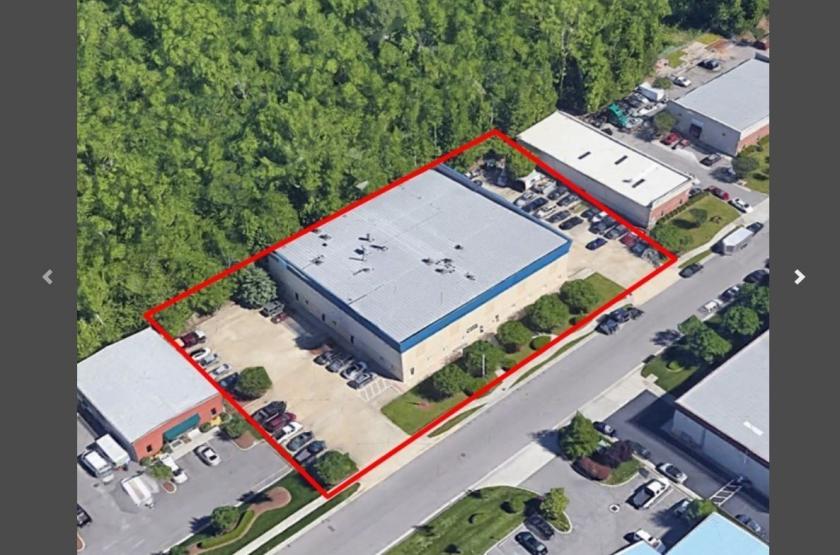
3440 Chandler Creek Road Virginia Beach, VA 23453
3440 Chandler Creek Road Virginia Beach, VA 23453
Details & Description
Additional Photos

Listing Agents

Michael Zarpas
O: 757-640-2235
M: 757-286-1783
mzarpas@slnusbaum.com
O: 757-640-2235
M: 757-286-1783
mzarpas@slnusbaum.com
While we strive to provide the most accurate information, all listing information, and demographic data, is provided by third-parties. As such, MyEListing will not be responsible for the accuracy of the information. It is strongly recommended that you verify all information with the listing agent, and any relevant agencies, prior to making any decisions.


