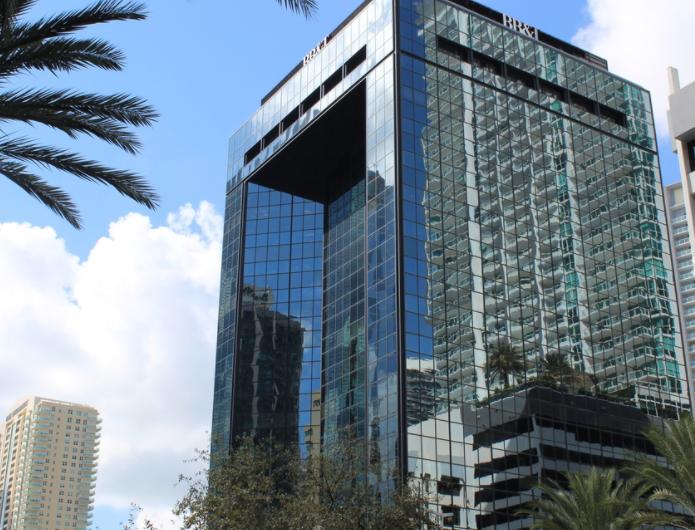
1200 Brickell is one of Miami's finest office-condo in the heart of Miami's Financial District, it offers a unique opportunity to
lease prime commercial real estate in one of the world' s most important cities. The 20-story office building, 235,432 RSF, has a
luxury lobby, an open landscape plaza, sweeping semi-circular drop-off driveway for visitor's convenience.Strategically located on the best and most exposed corner of Brickell Avenue (Coral Way and Brickell Avenue), surrounded by a mecca of international commerce. Next to Miami' s finest hotels and restaurants. Easy access through South Miami Avenue and to major highways such as I-95 and just minutes away from Miami International Airport and Port of Miami.
Highlights
On site management and 24-hour security
Anchored by BB&T located on the ground-level
Amazing views of Brickell Ave
Floor to ceiling windows
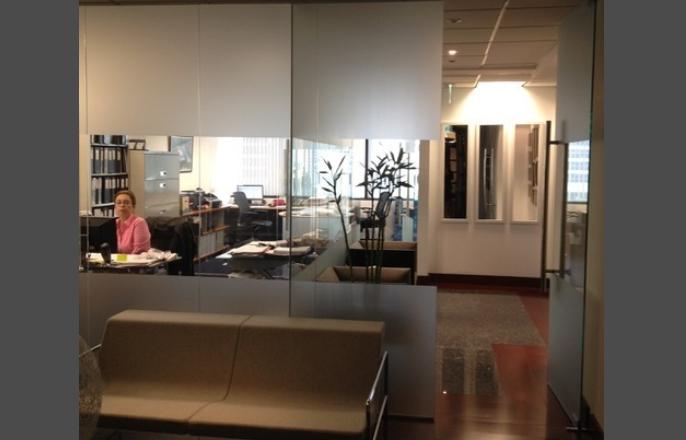
Convenient lobby area
Efficient work areas
Main elevator exposure
Abundant parking
No part of this information may be copied, reproduced, repurposed, or screen-captured for any commercial purpose without prior written authorization from MyEListing.
While we strive to provide the most accurate information, all listing information, and demographic data, is provided by third-parties. As such, MyEListing will not be responsible for the accuracy of the information. It is strongly recommended that you verify all information with the listing agent, and any relevant agencies, prior to making any decisions.
What is the asking price for 1200 Brickell Avenue in Miami?
The asking price for 1200 Brickell Avenue is $33.00 a SF per Year
What is the building size of this commercial Office property?
The size of this lease property at '.1200 Brickell Avenue.' is 1375 square feet
What kind of Office is the propery at 1200 Brickell Avenue?
The property at 1200 Brickell Avenue Miami, FL 33131 is listed as a Professional Office property
What is the population within 1 mile of 1200 Brickell Avenue in Miami?
The population within 1 mile of 1200 Brickell Avenue Miami, FL 33131 is 110,632 people.
Who do I contact for questions about 1200 Brickell Avenue?
You should contact the listing agent,
Fabio Faerman, for any details regarding this commercial listing.